SIP Comparison Calculator
Are you tired of switching between different SIP calculators just to compare scenarios?
One tool shows future value of your SIP. Another tells you the monthly SIP needed for a goal.
But none let you compare multiple SIP amounts across different return rates side-by-side — and then instantly flip to Goal Planner Mode where you enter target amounts and get required SIPs for the same return rates.
Until now.
Welcome to Wealthpedia’s SIP Comparison Calculator — India’s first true 2-in-1 SIP Comparison + Goal Planner Calculator.
Completely free. No login. No email. No data stored on our servers.
This interactive tool lets you compare multiple SIP amounts or multiple goal targets across three different return rates (Conservative, Moderate, Aggressive) in a single, live-updating table.
In this in-depth guide, you’ll discover every feature, how the revolutionary 2-in-1 toggle works, why this calculator is unmatched in India, step-by-step usage instructions, real-life examples, and answers to all your questions.
What is the Wealthpedia SIP Comparison Calculator?
The SIP Comparison Calculator is an advanced, interactive web tool designed for serious Indian investors who want clarity through comparison.
Instead of calculating one SIP scenario at a time, it displays multiple scenarios simultaneously in one clean table. You can:
- Compare 3, 5, or even 10 different monthly SIP amounts at 3 different expected return rates. (completely editable)
- Instantly see projected corpus, real (inflation-adjusted) value, and wealth multiple.
- Or toggle to Goal Planner Mode and enter target corpus amounts — the tool instantly calculates the exact monthly SIP required at each return rate.
All calculations update live as you type or toggle. No “Calculate” button. No waiting.
Core Features of This SIP Comparison Calculator
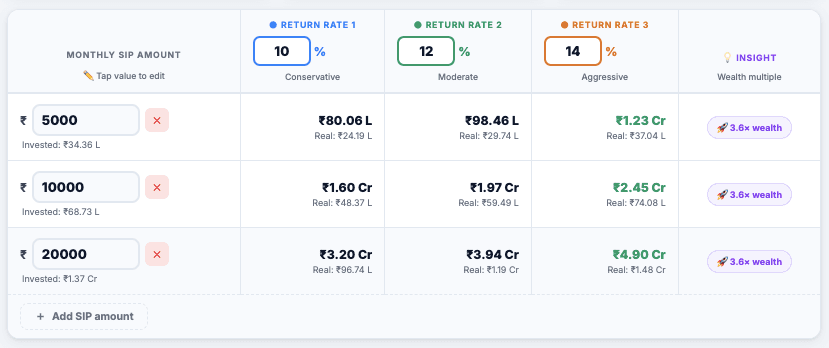
1. Side-by-Side Comparison Table (The Heart of the Tool)
- Three return rate columns (default: 10%, 12%, 14%) that you can edit live in the header.
- Multiple editable rows — start with 3 rows (₹5,000 / ₹10,000 / ₹20,000 SIP) and keep adding more.
- Every cell updates instantly with:
- Projected future corpus
- Inflation-adjusted real value
- Wealth multiple (how many times your money grew)
2. Revolutionary 2-in-1 Toggle: SIP Mode ↔ Goal Planner Mode
This is the unique feature no other calculator in India offers (verified as of April 2026).
- SIP Mode (default): You enter monthly SIP amounts → tool shows future corpus at different returns.
- Goal Planner Mode (one toggle): You enter target corpus amounts → tool instantly shows the monthly SIP required at each return rate.
The same table transforms instantly. No page refresh. No separate tools.
3. Step-Up SIP Simulation (Real-Life Accuracy)
Toggle Step-Up SIP ON and choose annual increase (5–30%). The calculator automatically compounds your SIP every year (exactly like salary hikes) and shows higher effective corpus.
4. Inflation Adjustment for Real Value
Every result shows both nominal future value and today’s purchasing power after inflation. Essential for realistic goal planning.
5. Insight Column
- In SIP Mode: Shows “🚀 X× wealth multiple”
- In Goal Planner Mode: Shows “Save ₹X/month at higher return vs conservative”
6. Fully Responsive & Mobile-First Design
Works beautifully on phone, tablet, and desktop. Table is swipeable on mobile with a helpful “← Swipe to see all columns →” hint.
7. Add / Delete Rows Instantly
Keep adding as many SIP amounts or goal targets as you want. Delete rows with one click. Minimum one row required.
8. Zero Data Collection
No login. No email. No tracking. Your calculations stay private on your device.
How the 2-in-1 SIP & Goal Planner Mode Works (Step-by-Step Explanation)
This is the feature that makes this calculator India’s first and only of its kind.
On Load (SIP Comparison Mode):
- You see three rows pre-filled with common SIP amounts (₹5,000, ₹10,000, ₹20,000).
- Three return rate columns (10% Conservative, 12% Moderate, 14% Aggressive).
- You can immediately edit any SIP amount or return rate.
- Table updates live showing future corpus for 5–40 year tenures.
One Toggle = Goal Planner Mode:
- Flip the “🎯 Goal Planner Mode” toggle.
- The first column label instantly changes from “Monthly SIP Amount” to “Target Corpus”.
- Pre-filled rows change to realistic goal amounts (₹50 lakh, ₹1 Cr, ₹2 Cr).
- Every cell now shows monthly SIP required to reach that exact target at each return rate.
- The Insight column now shows how much SIP you save by choosing a higher return rate.
- Toggle back to SIP mode — everything reverts instantly.
This seamless switch between “What will my SIP grow into?” and “How much SIP do I need for this goal?” in the same table has never been done before in any free Indian tool.
Why This SIP Comparison Calculator is India’s First & Best in the Industry
After extensive research across Groww, Zerodha, ET Money, Policybazaar, Nippon India, SBI, Axis, SEBI Investor, and every major AMC calculator (as of April 2026), no tool offers this exact combination:
- Live side-by-side comparison of multiple SIP amounts across multiple return rates in one editable table.
- Instant toggle to Goal Planner Mode with required SIP calculation.
- Step-up SIP + inflation adjustment in both modes.
- Editable return rates directly in column headers.
- Insight column with actionable savings or multiples.
Most tools are single-scenario calculators. This one is a true comparison engine that lets you visualise trade-offs instantly.
Step-by-Step: How to Use the SIP Comparison Calculator
Open the Tool
Visit the SIP Comparison Calculator on Wealthpedia
Choose Your Mode
Leave toggle OFF for SIP Comparison Mode.
Turn ON for Goal Planner Mode.
Set Investment Period & Inflation
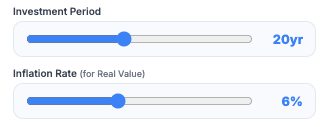
Use the sliders (default: 20 years, 6% inflation).
Turn Step-Up SIP ON (Recommended)
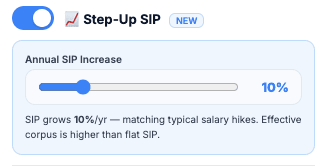
Choose your expected annual increase (10% is realistic).
Edit the Table
Click any value in the first column and type new SIP or goal amount.
Click any return rate in the header to change it.
Click “Add SIP amount” (or “Add corpus target”) to add more rows.
Read the Results
Future corpus / Required SIP appears instantly.
Real (inflation-adjusted) value shown below.
Insight pill gives clear action point.
Reset Anytime
Click the circular reset button in the header.
Real-Life Use Cases & Examples
Example 1: SIP Comparison (Normal Mode) You want to compare ₹8,000 vs ₹12,000 vs ₹18,000 monthly SIP for 20 years. With step-up at 10%, you instantly see:
- ₹8k SIP → ~₹85 lakh
- ₹12k SIP → ~₹1.28 Cr
- ₹18k SIP → ~₹1.92 Cr
Example 2: Goal Planner Mode You have three goals: ₹50 lakh house fund, ₹1 Cr education corpus, ₹2 Cr retirement corpus in 18 years. The tool instantly shows exact monthly SIP needed at 10%, 12%, and 14% returns — helping you decide realistic targets.
Benefits of Using This SIP Comparison Calculator
- Save hours of manual Excel work.
- Make data-driven decisions by comparing scenarios side-by-side.
- Understand the massive impact of even 2% extra return.
- Plan goals accurately with inflation and step-up.
- Teach family members the power of compounding visually.
- Zero cost, zero privacy risk.
Frequently Asked Questions (FAQs)
Is this SIP Comparison Calculator really free?
Yes. 100% free forever. No login, no email, no data stored.
Is this the first 2-in-1 SIP & Goal Planner in India?
Yes. As of April 2026, no other free tool offers live side-by-side comparison with an instant toggle between SIP mode and Goal Planner mode in a single table.
Can I compare more than 3 scenarios?
Yes. Keep clicking “Add row” to add unlimited rows.
Does it account for step-up SIP?
Yes. Toggle it on and choose your annual increase percentage.
How accurate are the calculations?
Uses correct monthly compounding formula. Results are estimates based on assumed returns.
Can I use it for different investment periods?
Yes. The period slider changes everything instantly.
Is this suitable for mutual funds only?
Yes — designed primarily for equity/debt mutual fund SIPs, but works for any asset class with expected returns.
Final Thoughts: Why This Tool Matters in 2026
In an era of information overload, investors don’t need more calculators — they need better comparison tools that show trade-offs instantly.
The Wealthpedia SIP Comparison Calculator delivers exactly that — India’s first true 2-in-1 solution that combines powerful side-by-side SIP comparison with seamless Goal Planner functionality.
Whether you are a beginner comparing small SIPs or an experienced investor planning multiple large goals, this tool gives you clarity in seconds.
Try it now — completely free:
Bookmark it. Share it with friends. Use it every time you plan your next SIP.
Because the best financial decisions are made when you can see all scenarios at once.