
A candlestick is a type of price chart used in technical analysis to represent the price movement of a financial instrument, such as a stock, currency pair, or commodity, over a specific time period.
Select Your Favorite Section
A candlestick consists of a rectangular body and two thin lines, called “wicks” or “shadows,” which extend from the top and bottom of the body. The body of the candlestick represents the opening and closing prices of the financial instrument during the specified time period, while the wicks or shadows represent the high and low prices.
Candlestick charts provide a visual representation of price movements and are often used to identify patterns that can signal potential trend reversals or changes in market sentiment. Some common candlestick patterns include the doji, hammer, and shooting star. Traders and analysts often use candlestick charts in combination with other technical and fundamental analysis tools to make trading decisions.
Candlestick charts are a popular tool used by traders to analyze the price movements of financial instruments, such as stocks, currencies, and commodities. In this response, I will explain all about candlestick charts in this article.
Overview of Candlestick Charts
Candlestick charts are a type of chart used in technical analysis to represent the price movements of financial instruments. They consist of a series of candlesticks, with each candlestick representing a specific period of time, such as a day, week, or month. The candlestick is composed of a body, which represents the price range between the open and close of the period, and two wicks, which represent the highest and lowest prices reached during the period.
Candlesticks are colored differently depending on whether the price closed higher or lower than the opening price. A bullish candlestick, which indicates that the price closed higher than the opening price, is typically colored green or white, while a bearish candlestick, which indicates that the price closed lower than the opening price, is typically colored red or black.
Candlestick patterns are formed by a series of candlesticks that have particular shapes, sizes, and locations on the chart. These patterns are used to identify potential changes in the direction of the price trend or to confirm existing trends. Some commonly used candlestick patterns include the doji, hammer, hanging man, shooting star, and engulfing pattern.
History of Candlestick Charts
Candlestick charts originated in Japan in the 18th century and were used by rice traders to analyze the price movements of rice futures. The technique was later introduced to the West by Steve Nison, who popularized candlestick charting in the 1990s.
The use of candlestick charts in trading has grown significantly in popularity over the past few decades, with many traders using them to identify potential trading opportunities and make more informed trading decisions.
Candlestick Components
Each candlestick on a chart represents a specific period of time, such as a day, week, or month. The body of the candlestick represents the price range between the open and close of the period, while the wicks or shadows represent the highest and lowest prices reached during the period.
Bullish Candlesticks
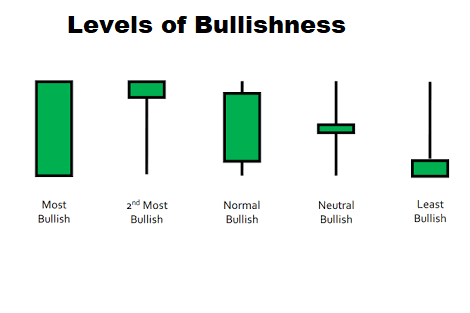
A bullish candlestick is formed when the closing price is higher than the opening price, indicating that buyers were in control of the market during the period. The body of a bullish candlestick is typically colored green or white and represents the price range between the opening and closing prices. The upper wick of the candlestick represents the highest price reached during the period, while the lower wick represents the lowest price reached.
Bearish Candlesticks

A bearish candlestick is formed when the closing price is lower than the opening price, indicating that sellers were in control of the market during the period. The body of a bearish candlestick is typically colored red or black and represents the price range between the opening and closing prices. The upper wick of the candlestick represents the highest price reached during the period, while the lower wick represents the lowest price reached.
Doji

A doji is a candlestick pattern that forms when the opening and closing prices are the same or nearly the same. The doji pattern can indicate indecision in the market and a potential reversal in the price trend.
Hammer
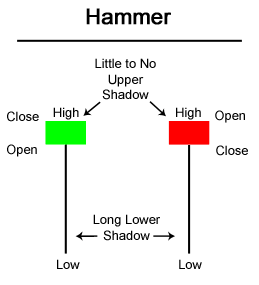
A hammer is a candlestick pattern that forms when the opening and closing prices are near the top of the candlestick’s range, and there is a long lower wick. The hammer pattern can indicate a potential reversal in a downtrend, as buyers have stepped in and pushed the price up from its lows.
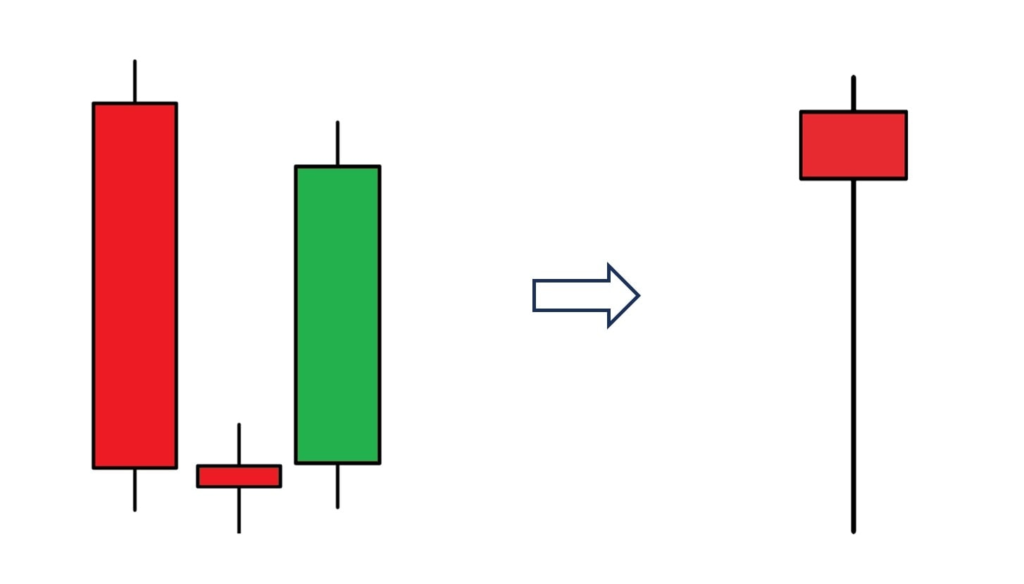
Hanging man
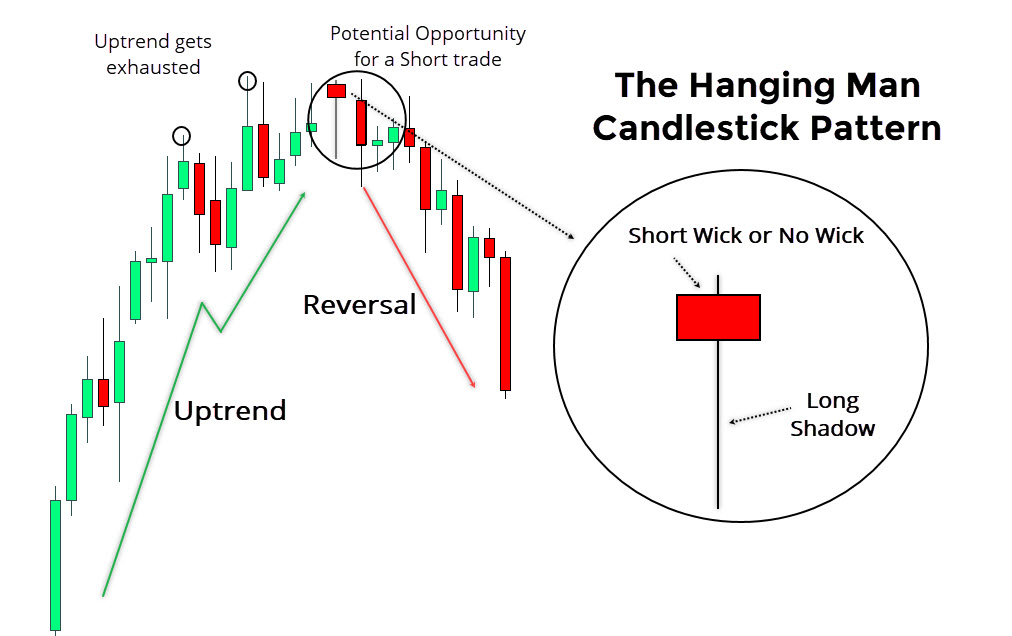
A hanging man is a bearish candlestick pattern that is formed at the end of an uptrend. The pattern is characterized by a small body with a long lower wick, which resembles a hanging man. The pattern is called a hanging man because it looks like a person who is hanging upside down.
The hanging man pattern is formed when the market opens above the previous day’s close and then sells off during the day, with buyers eventually stepping in and pushing the price back up, but not enough to close above the opening price. This creates a small body with a long lower wick and little or no upper wick, indicating that the sellers were in control for most of the period.
The hanging man pattern is considered a bearish signal, as it suggests that the uptrend may be coming to an end and that a reversal may be imminent. Traders often look for confirmation of the pattern by looking for a bearish follow-up candlestick, such as a bearish engulfing pattern or a long black candlestick.
However, it is important to note that the hanging man pattern is not a guaranteed signal of a reversal and should be used in conjunction with other technical indicators and fundamental analysis to make well-informed trading decisions. Additionally, traders should consider the context of the market, such as the trend, volume, and support and resistance levels, before making any trades based on the hanging man pattern.
Shooting Star

A shooting star is a bearish pattern that is formed at the top of an uptrend. It has a small body with a long upper wick and little or no lower wick. The pattern suggests that the buying pressure is starting to weaken and that sellers are stepping in to push the price down.
Engulfing
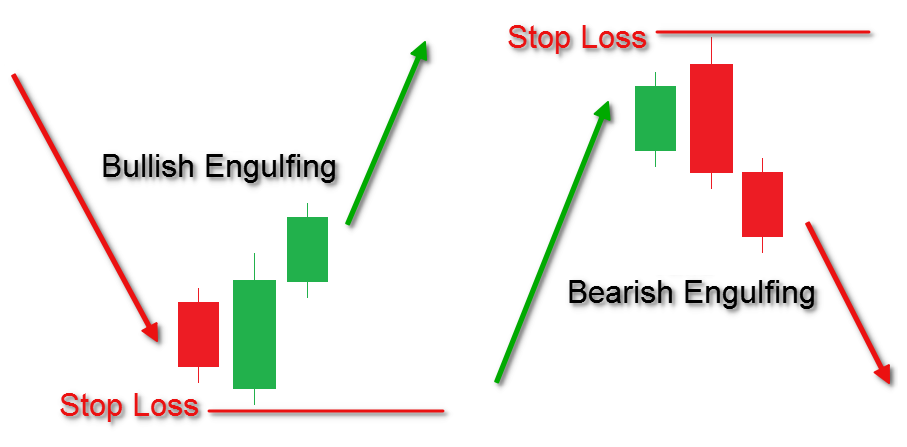
An engulfing pattern occurs when a candlestick completely engulfs the previous candlestick, indicating a potential trend reversal. A bullish engulfing pattern occurs when a green candlestick completely engulfs a red candlestick, while a bearish engulfing pattern occurs when a red candlestick completely engulfs a green candlestick.
Morning Star
A morning star is a bullish pattern that is formed at the bottom of a downtrend. It consists of a long red candlestick, followed by a small doji or spinning top, and then a long green candlestick. The pattern suggests that the selling pressure is starting to weaken and that buyers are starting to gain control of the market.
Evening Star

An evening star is a bearish pattern that is formed at the top of an uptrend. It consists of a long green candlestick, followed by a small doji or spinning top, and then a long red candlestick. The pattern suggests that the buying pressure is starting to weaken and that sellers are starting to gain control of the market.
Using Candlestick Patterns in Trading
Candlestick patterns can be used in conjunction with other technical indicators and fundamental analysis to make well-informed trading decisions. Traders often look for confirmation of a pattern by looking for additional signals, such as changes in volume or momentum. They also consider the context of the market, such as the trend, support and resistance levels, and any news or events that may be affecting the price.
One common trading strategy is to use candlestick patterns to identify potential trade entry and exit points. For example, a trader may look for a hammer pattern at the bottom of a downtrend as a potential signal to enter a long position. Conversely, a trader may look for a shooting star pattern at the top of an uptrend as a potential signal to exit a long position or enter a short position.
It’s important to note that candlestick patterns are not a guaranteed signal of a reversal or trend continuation, and should not be used in isolation. Traders should also consider risk management and position sizing when making trades based on candlestick patterns.
Best candle stick settings
There is no one “best” candlestick setting that applies to all trading strategies, financial instruments, or timeframes. The ideal candlestick setting can vary depending on the specific context of your trading, such as your trading style, the market you are trading in, and the timeframe you are using.
In general, the time period used for each candlestick on a chart should reflect the trading timeframe you are interested in. For example, if you are a short-term trader and focus on intraday trading, you may use candlesticks that represent 1-minute or 5-minute time periods. If you are a long-term investor and focus on the big picture, you may use candlesticks that represent weekly or monthly time periods.
Additionally, the specific candlestick patterns you look for can vary based on your trading strategy and the market conditions. For example, a bullish engulfing pattern may be more relevant in a trending market, while a doji may be more relevant in a range-bound market.
Ultimately, the best way to determine the optimal candlestick settings for your trading strategy is to experiment with different settings and observe how the charts look in different market conditions. It’s also important to combine candlestick analysis with other technical and fundamental analysis tools to make well-informed trading decisions.
What candlestick pattern represents?
Candlestick patterns represent the open, high, low, and close prices of an asset over a given period of time. The patterns can provide important information about the price action and sentiment of the market, which can help traders make trading decisions.
Candlestick patterns can be bullish, bearish, or neutral. Bullish candlestick patterns indicate that the market is likely to move higher, while bearish patterns indicate that the market is likely to move lower. Neutral patterns indicate that the market is likely to move sideways or consolidate.
Some common candlestick patterns include:
- Hammer: A bullish reversal pattern that has a long lower shadow and a small real body at the top of the candlestick.
- Shooting Star: A bearish reversal pattern that has a long upper shadow and a small real body at the bottom of the candlestick.
- Doji: A neutral pattern that has a small real body and indicates that the market is indecisive.
- Engulfing Pattern: A bullish or bearish reversal pattern that occurs when a small candlestick is followed by a larger candlestick that completely engulfs the previous candlestick.
- Morning Star: A bullish reversal pattern that has a long bearish candlestick, followed by a small candlestick, and then a long bullish candlestick.
- Evening Star: A bearish reversal pattern that has a long bullish candlestick, followed by a small candlestick, and then a long bearish candlestick.
There are many other candlestick patterns, and traders should learn to recognize and interpret them in the context of the overall market trend and other technical analysis tools. It is important to note that candlestick patterns should not be used in isolation and should be used in conjunction with other technical analysis tools and market fundamentals to make well-informed trading decisions.
Benefits of candlestick
There are several benefits to using candlestick charts for technical analysis, including:
- Visual representation of price action: Candlestick charts provide a visual representation of price action, making it easy to see the relationship between the opening, closing, high, and low prices for each time period.
- Easy to read: Candlestick charts are easy to read and provide more detailed information about price movement than traditional bar charts.
- Identification of patterns: Candlestick charts help traders identify patterns, such as trend lines, support and resistance levels, and reversal patterns, which can help traders make well-informed trading decisions.
- Analysis of market sentiment: Candlestick charts can help traders gauge market sentiment by showing whether the market is bullish or bearish, and the strength of the trend.
- Confirmation of other technical indicators: Candlestick patterns can help confirm other technical indicators, such as moving averages, volume, and oscillators, which can help traders make more confident trading decisions.
- Widely used and supported: Candlestick charts are widely used and supported by most trading platforms, making them easily accessible to traders.
Overall, candlestick charts are a powerful tool for technical analysis and can help traders improve their chances of success in the markets. By using candlestick charts in conjunction with other technical analysis tools and market fundamentals, traders can make well-informed trading decisions and improve their trading performance.
How to find market direction using candlestick?
Candlestick charts can be used to help identify the market direction, but they should not be used in isolation. It is important to use candlestick patterns in conjunction with other technical analysis tools and market fundamentals to get a more complete picture of the market direction.
Here are a few ways that candlestick patterns can be used to identify market direction:
- Look for trends: One of the most basic ways to identify market direction is to look for trends on the chart. Bullish trends are characterized by higher highs and higher lows, while bearish trends are characterized by lower highs and lower lows. Candlestick patterns can help confirm the trend and identify potential reversals.
- Identify key support and resistance levels: Support and resistance levels are areas on the chart where the price has previously found buying or selling pressure. Candlestick patterns that form near these levels can help identify potential trend reversals or continuations.
- Look for reversal patterns: Candlestick patterns that indicate a potential reversal can help identify a change in market direction. For example, a bullish reversal pattern, such as a hammer or a morning star, may indicate a potential trend reversal from bearish to bullish.
- Use moving averages: Moving averages are trend-following indicators that can help identify the market direction. When the price is above the moving average, the trend is considered bullish, and when the price is below the moving average, the trend is considered bearish. Candlestick patterns that form near the moving average can help confirm the trend and identify potential trade opportunities.
In summary, candlestick patterns can be used in conjunction with other technical analysis tools to help identify the market direction. It is important to use multiple tools and techniques to get a more complete picture of the market and make well-informed trading decisions.
Candlestick and price action
Candlestick patterns are a type of price action, which refers to the movement of an asset’s price on a chart over time. Price action traders use charts and technical analysis to identify patterns in price movements and make trading decisions based on those patterns.
Candlestick charts are a popular type of chart used in price action analysis. They provide a visual representation of price movements and can help traders identify potential reversals or trend continuations. Candlestick patterns are formed by the open, high, low, and close prices of an asset over a given period of time, such as a day or a week.
Price action traders use candlestick patterns to make trading decisions, such as when to enter or exit a position. For example, a bullish candlestick pattern, such as a hammer or a bullish engulfing pattern, may indicate a potential buy signal, while a bearish candlestick pattern, such as a shooting star or a bearish engulfing pattern, may indicate a potential sell signal.
Price action traders also use other technical indicators, such as support and resistance levels, moving averages, and trend lines, to confirm or validate candlestick patterns. They may also look at other factors, such as market sentiment, news events, and economic data, to make well-informed trading decisions.
In summary, candlestick patterns are a type of price action that price action traders use to make trading decisions. By understanding how candlestick patterns form and how they can be used in conjunction with other technical indicators and fundamental analysis, traders can improve their chances of success in the markets.
How to master candlestick?
Mastering candlestick patterns requires a combination of knowledge, experience, and discipline. Here are some tips to help you improve your candlestick trading skills:
- Learn the basics: Start by learning the different types of candlestick patterns and what they mean. Study the charts and try to identify the patterns on your own. There are many books, online courses, and resources available to help you learn the basics.
- Practice: The more you practice identifying and interpreting candlestick patterns, the better you will become. Start by looking at historical charts and identifying patterns, and then move on to real-time charts.
- Use a demo account: Many online brokers offer demo accounts that allow you to practice trading with virtual money. This is a great way to test your candlestick trading skills without risking real money.
- Use other technical indicators: Candlestick patterns are just one tool in a trader’s toolbox. To improve your trading, you should also use other technical indicators such as moving averages, oscillators, and trend lines.
- Develop a trading plan: Before you make any trades based on candlestick patterns, develop a trading plan that includes your entry and exit points, stop-loss levels, and position size. Stick to your plan and don’t let emotions influence your trading decisions.
- Manage your risk: Like all trading, candlestick trading involves risk. To manage your risk, use appropriate position sizing and stop-loss orders. Don’t risk more than you can afford to lose.
- Keep a trading journal: Keeping a trading journal can help you track your progress and identify areas for improvement. Record your trades, including the candlestick patterns you identified and the outcome of the trade.
- Stay disciplined: To be successful at candlestick trading, you need to be disciplined and patient. Stick to your trading plan and don’t deviate from it based on emotions or impulsive decisions.
In summary, mastering candlestick patterns requires knowledge, experience, and discipline. By following these tips, you can improve your candlestick trading skills and increase your chances of success.
Do candlestick really tell you the market direction?
Candlestick charts can provide valuable information about market direction, but they are just one tool among many that traders use to make trading decisions.
Candlestick charts are a type of price chart that displays the opening, high, low, and closing prices of a financial instrument for a specific time period. Each candlestick represents a single time period, such as a day or an hour. The body of the candlestick shows the opening and closing prices, while the wicks or shadows indicate the high and low prices.
The patterns formed by candlesticks can provide insight into the market’s sentiment and can be used to identify potential trend reversals, momentum shifts, and support and resistance levels. However, it’s important to note that candlestick patterns are not foolproof and should always be considered in the context of other technical and fundamental indicators.
Additionally, market direction can be influenced by a variety of factors beyond just price movements, such as economic data, news events, and geopolitical developments. So while candlestick charts can be a useful tool, it’s important to consider a variety of factors when making trading decisions.

