
Retirement planning feels like a math problem most of the time.
You calculate:
Select Your Favorite Section
- How much you’ll need.
- How much you’ll save.
- What returns you’ll get.
And then, you sit back thinking, “If I earn an average of 7% per year, I’ll be fine.”
But here’s the dirty little secret nobody tells you: averages lie.
Your financial future doesn’t just depend on how much return you earn. It depends on when you earn it.
This silent but dangerous factor is called Sequence of Return Risk (SORR).
A Tale of Two Retirees
To understand this risk, let me introduce you to two fictional retirees:
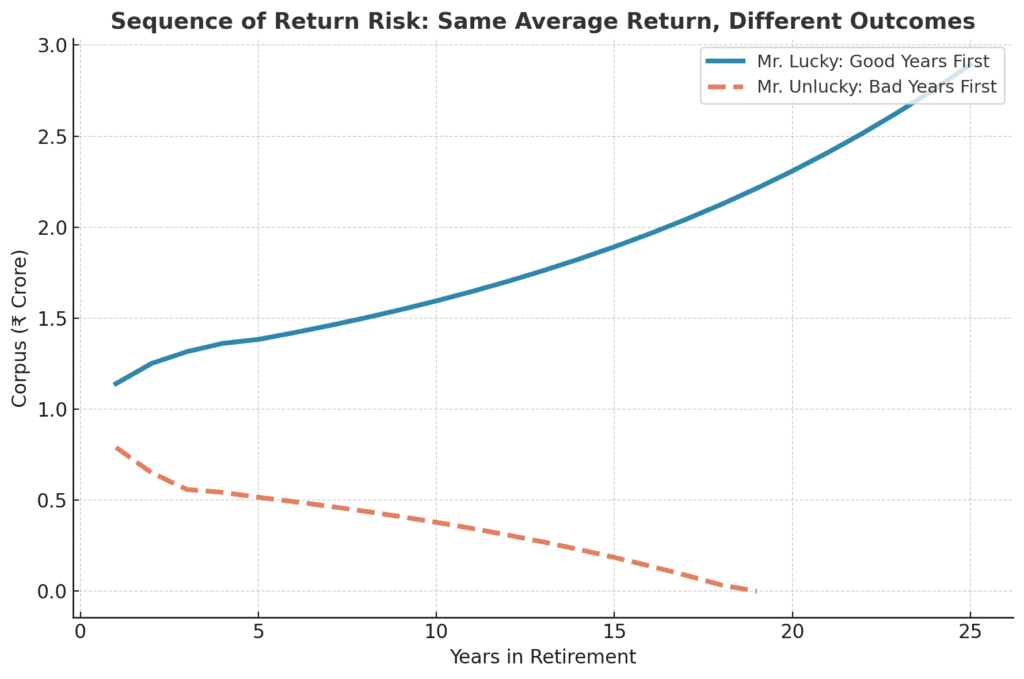
- Mr. Lucky – who retires right before a bull run.
- Mr. Unlucky – who retires right before a market crash.
Both of them:
- Retire at 60 with ₹1 crore saved.
- Plan to withdraw ₹6 lakh per year for living expenses.
- Expect to earn an average of 7% return from their portfolio.
- Have the same 25-year retirement horizon.
On paper, both should be fine, right? After all, 7% average return is pretty good.
But as you’ll see… the order of returns changes everything.
The Market Roller Coaster
Here’s the sequence of returns they face:
| Year | Mr. Lucky’s Return | Mr. Unlucky’s Return |
|---|---|---|
| 1 | +20% | -15% |
| 2 | +15% | -10% |
| 3 | +10% | -5% |
| 4 | +8% | +8% |
| 5 | +6% | +6% |
| 6–25 | +7% each year | +7% each year |
Notice: Both get the same average return over 25 years.
The only difference? Mr. Lucky starts with good years, Mr. Unlucky starts with bad years.
Let’s Crunch the Numbers
To really feel the difference, let’s look at what happens in the first 6 years.
Mr. Lucky (Good Years First)
| Year | Start Corpus (₹) | Return % | Gain/Loss (₹) | Withdrawal (₹) | End Corpus (₹) |
|---|---|---|---|---|---|
| 1 | 1,00,00,000 | 20% | +20,00,000 | 6,00,000 | 1,14,00,000 |
| 2 | 1,14,00,000 | 15% | +17,10,000 | 6,00,000 | 1,25,10,000 |
| 3 | 1,25,10,000 | 10% | +12,51,000 | 6,00,000 | 1,31,61,000 |
| 4 | 1,31,61,000 | 8% | +10,52,880 | 6,00,000 | 1,36,13,880 |
| 5 | 1,36,13,880 | 6% | +8,16,832 | 6,00,000 | 1,38,30,712 |
| 6 | 1,38,30,712 | 7% | +9,68,150 | 6,00,000 | 1,41,98,862 |
By year 6, Mr. Lucky’s portfolio has grown to nearly ₹1.42 crore.
Mr. Unlucky (Bad Years First)
| Year | Start Corpus (₹) | Return % | Gain/Loss (₹) | Withdrawal (₹) | End Corpus (₹) |
|---|---|---|---|---|---|
| 1 | 1,00,00,000 | -15% | -15,00,000 | 6,00,000 | 79,00,000 |
| 2 | 79,00,000 | -10% | -7,90,000 | 6,00,000 | 65,10,000 |
| 3 | 65,10,000 | -5% | -3,25,500 | 6,00,000 | 55,84,500 |
| 4 | 55,84,500 | 8% | +4,46,760 | 6,00,000 | 54,31,260 |
| 5 | 54,31,260 | 6% | +3,25,876 | 6,00,000 | 51,57,136 |
| 6 | 51,57,136 | 7% | +3,61,000 | 6,00,000 | 49,18,136 |
By year 6, Mr. Unlucky’s portfolio is down to just ₹49 lakh.
Same average return, completely different outcomes.
📊 Mr. Lucky’s Retirement Portfolio (Good Years First)
| Year | Return % | Gain/Loss (₹) | Withdrawal (₹) | End Corpus (₹) |
|---|---|---|---|---|
| 1 | 20.0 | 20,00,000 | 6,00,000 | 1,14,00,000 |
| 2 | 15.0 | 17,10,000 | 6,00,000 | 1,25,10,000 |
| 3 | 10.0 | 12,51,000 | 6,00,000 | 1,31,61,000 |
| 4 | 8.0 | 10,52,880 | 6,00,000 | 1,36,13,880 |
| 5 | 6.0 | 8,16,832 | 6,00,000 | 1,38,30,712 |
| 6 | 7.0 | 9,68,150 | 6,00,000 | 1,41,98,862 |
| 7 | 7.0 | 9,93,920 | 6,00,000 | 1,45,92,782 |
| 8 | 7.0 | 10,21,495 | 6,00,000 | 1,50,14,277 |
| 9 | 7.0 | 10,51,000 | 6,00,000 | 1,54,65,277 |
| 10 | 7.0 | 10,82,569 | 6,00,000 | 1,59,47,846 |
| 11 | 7.0 | 11,16,350 | 6,00,000 | 1,64,64,196 |
| 12 | 7.0 | 11,52,494 | 6,00,000 | 1,70,16,690 |
| 13 | 7.0 | 11,91,169 | 6,00,000 | 1,76,07,859 |
| 14 | 7.0 | 12,32,551 | 6,00,000 | 1,82,40,410 |
| 15 | 7.0 | 12,76,829 | 6,00,000 | 1,89,17,239 |
| 16 | 7.0 | 13,24,207 | 6,00,000 | 1,96,41,446 |
| 17 | 7.0 | 13,74,901 | 6,00,000 | 2,04,16,347 |
| 18 | 7.0 | 14,29,145 | 6,00,000 | 2,22,45,492 |
| 19 | 7.0 | 14,87,185 | 6,00,000 | 2,20,32,677 |
| 20 | 7.0 | 15,49,288 | 6,00,000 | 2,29,81,965 |
| 21 | 7.0 | 16,15,737 | 6,00,000 | 2,39,97,702 |
| 22 | 7.0 | 16,86,839 | 6,00,000 | 2,50,84,541 |
| 23 | 7.0 | 17,62,918 | 6,00,000 | 2,62,47,459 |
| 24 | 7.0 | 18,44,322 | 6,00,000 | 2,74,91,781 |
| 25 | 7.0 | 19,31,425 | 6,00,000 | 2,88,23,206 |
👉 Mr. Lucky retires with ₹2.88 crore left after 25 years.
📉 Mr. Unlucky’s Retirement Portfolio (Bad Years First)
| Year | Return % | Gain/Loss (₹) | Withdrawal (₹) | End Corpus (₹) |
|---|---|---|---|---|
| 1 | -15.0 | -15,00,000 | 6,00,000 | 79,00,000 |
| 2 | -10.0 | -7,90,000 | 6,00,000 | 65,10,000 |
| 3 | -5.0 | -3,25,500 | 6,00,000 | 55,84,500 |
| 4 | 8.0 | 4,46,760 | 6,00,000 | 54,31,260 |
| 5 | 6.0 | 3,25,876 | 6,00,000 | 51,57,136 |
| 6 | 7.0 | 3,61,000 | 6,00,000 | 49,18,136 |
| 7 | 7.0 | 3,44,269 | 6,00,000 | 46,62,405 |
| 8 | 7.0 | 3,26,368 | 6,00,000 | 43,88,773 |
| 9 | 7.0 | 3,07,214 | 6,00,000 | 41,05,987 |
| 10 | 7.0 | 2,87,419 | 6,00,000 | 38,12,406 |
| 11 | 7.0 | 2,66,868 | 6,00,000 | 35,09,274 |
| 12 | 7.0 | 2,45,650 | 6,00,000 | 31,94,924 |
| 13 | 7.0 | 2,23,644 | 6,00,000 | 28,68,568 |
| 14 | 7.0 | 2,00,800 | 6,00,000 | 25,29,368 |
| 15 | 7.0 | 1,77,056 | 6,00,000 | 21,77,424 |
| 16 | 7.0 | 1,52,419 | 6,00,000 | 18,12,843 |
| 17 | 7.0 | 1,26,899 | 6,00,000 | 14,39,742 |
| 18 | 7.0 | 1,00,578 | 6,00,000 | 10,55,320 |
| 19 | 7.0 | 73,872 | 6,00,000 | 6,29,192 |
| 20 | 7.0 | 44,043 | 6,00,000 | 73,235 |
| 21 | 7.0 | 5,126 | 6,00,000 | 0 |
👉 Mr. Unlucky runs out of money by Year 21 (age 81).
⚡ Same average return (7%), but one ends up with crores, while the other goes broke. That’s sequence of return risk.
Why Did This Happen?
The culprit is the sequence of returns.
- Mr. Lucky’s early gains gave him a cushion. Even after withdrawals, his money kept growing.
- Mr. Unlucky’s early losses cut his portfolio in half. Withdrawals during those bad years meant he was taking money out of a shrinking pie. The hole became too deep to climb out of, even when good returns came later.
This is why sequence of return risk is the biggest danger during retirement withdrawals.
Why It Doesn’t Matter While You’re Saving
Interestingly, sequence risk barely matters when you’re accumulating wealth.
Suppose you’re 35 and investing ₹50,000 a year for 25 years. Whether you face bad years first or good years first, by the time you hit retirement, your corpus will be nearly the same—because you’re still adding money, and the compounding averages out.
But once you stop working and start withdrawing, sequence becomes everything. One bad stretch early in retirement can destroy decades of savings discipline.
The Psychology of It
Numbers aside, imagine the emotional roller coaster:
- Mr. Lucky retires at 60, sees his portfolio grow to ₹1.42 crore in just 6 years, and thinks, “Retirement is amazing. Maybe I’ll even take that world cruise.”
- Mr. Unlucky retires at 60, sees his nest egg fall to half by 66, and panics, “Will I run out of money by 75?”
The same average return. The same savings. Yet completely opposite emotional experiences.
That’s the terrifying power of sequence of return risk.
How Do You Protect Yourself?
Thankfully, you’re not completely helpless. Smart planning can reduce the damage.
1. Build a Cash Cushion
Keep 2–3 years’ worth of expenses in cash or liquid funds. When markets crash, live off this cushion instead of selling investments at a loss.
2. Bucket Strategy
Divide your money into “buckets”:
- Bucket 1 (Short-term): 2–3 years’ expenses in cash or debt.
- Bucket 2 (Medium-term): Bonds and balanced funds for the next 5–7 years.
- Bucket 3 (Long-term): Equity for growth.
This way, you’re not forced to sell equity during downturns.
3. Flexible Withdrawals
Don’t stick rigidly to withdrawing the same amount every year. Withdraw less during bad years and a little more during good years.
4. Partial Annuities
Convert part of your retirement corpus into an annuity or pension plan. This guarantees a base income, reducing pressure on your portfolio.
5. Reduce Equity Exposure Before Retirement
Don’t retire with 100% equity. Gradually shift to safer assets as retirement approaches.
The Bigger Lesson
Sequence of return risk is often ignored in retirement planning because it doesn’t show up in the glossy “average return” charts. But it can be the difference between:
- Living with financial security, freedom, and peace of mind (like Mr. Lucky).
- Living with constant fear of running out of money (like Mr. Unlucky).
So when you plan for retirement, don’t just ask:
“What average return can I expect?”
Instead, ask:
“What if I face the worst sequence of returns at the worst time?”
Because retirement is not just about math—it’s about timing, psychology, and resilience.
Final Words
If you’re in your 30s or 40s, sequence of return risk may sound distant. But building your retirement plan with it in mind will save you decades of stress later.
If you’re nearing retirement, the time to act is now. Build a safety net, diversify smartly, and protect yourself from being the next “Mr. Unlucky.”
Because in the game of retirement, you can’t control the market—but you can control your strategy.

