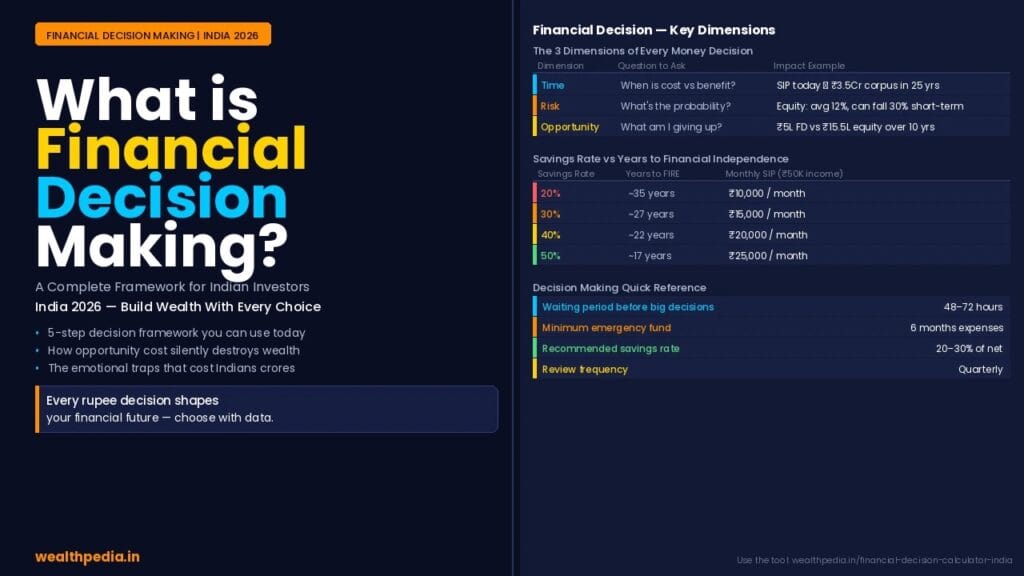

Opportunity cost is one of the most important and least understood concepts in personal finance. It is not a fee, a charge, or a loss that shows up on any statement. It is the cost of a road not taken — the financial value of the best alternative you sacrificed when you made a particular choice.
The formal definition, borrowed from economics, is straightforward: the opportunity cost of any decision is the value of the next best alternative foregone. When you choose to park ₹5 lakh in a savings bank account earning 3.5%, the opportunity cost is what that same ₹5 lakh would have earned in the best realistic alternative — say, a liquid mutual fund at 6.5% or a diversified equity fund at 12% CAGR over a decade. The money you did not earn is not visible on your bank statement, but it is absolutely real. It represents the gap between where you are financially and where you could have been.
In day-to-day Indian financial life, opportunity cost appears in dozens of forms. Every month you delay starting a SIP has an opportunity cost measured in lakhs over a 20-year horizon. Every rupee parked in a low-yielding instrument when a better alternative exists has an opportunity cost. Every rupee used to prepay a low-interest home loan instead of being invested in equity has an opportunity cost. Even the decision to buy a car on EMI versus paying cash has an opportunity cost — the interest you pay reduces the capital you could have invested.
What makes opportunity cost so powerful as a concept, and so dangerous when ignored, is that it is invisible. The financial loss is silent. There is no bill for the returns you did not earn. There is no notification that you missed ₹40 lakh in compounding by keeping your emergency fund in a savings account for 15 years instead of a liquid fund. The absence of a visible cost is precisely why most people never calculate it — and why the gap between good and poor financial decision makers compounds so dramatically over time.
Understanding opportunity cost is therefore not just an academic exercise. It is a practical lens that, applied consistently to your financial decisions, will reframe how you think about every rupee and significantly improve the quality of your long-term financial outcomes.
Quick Summary
Opportunity cost is the value of the best alternative you give up whenever you make a financial choice. Every rupee you spend, save, or invest in one place is a rupee not working somewhere else. For Indian investors, opportunity cost is the invisible force behind the most common wealth gaps — keeping money in savings accounts instead of investing, prepaying a low-interest home loan instead of building an equity corpus, or delaying a SIP by even five years. This guide explains what opportunity cost is, how to calculate it, and how to use the Financial Decision Calculator to make it visible before every major money decision.
Join Now →
Why Opportunity Cost Matters More in India Than Almost Anywhere
India presents a particularly high-stakes environment for opportunity cost thinking, for several reasons that are specific to the Indian financial landscape.
The Indian investment universe is unusually wide for retail investors. At any given moment, an Indian saver can choose between savings bank accounts (3–4%), liquid mutual funds (6–7%), short-duration debt funds (7–8%), fixed deposits (6.5–7.5%), PPF (7.1%), NPS (equity option, 10–12%), equity mutual funds (10–12% long-term CAGR), direct equity, real estate, gold, sovereign gold bonds (2.5% + gold price appreciation), REITs, and more. The spread between the lowest-yielding commonly used option (savings account) and the highest realistic long-term returner (equity mutual funds) is approximately 8–9 percentage points annually. Over 20 years, that spread translates to a difference of 4–5 times the terminal corpus on the same investment amount. In few other countries does the retail investor face such a consequential choice set.
India also has high inflation — averaging 6–7% over the past two decades — which makes the opportunity cost of low-yielding instruments particularly severe. Keeping money in a savings account at 3.5% when inflation runs at 6% means your real purchasing power is declining at approximately 2.5% per year. The opportunity cost here is not just the return foregone — it is an active destruction of wealth in real terms.
There is also the cultural context. Indians are historically conservative savers with a strong preference for guaranteed, fixed-return instruments — FDs, PPF, and real estate. These preferences are not irrational; they reflect decades of high inflation, economic uncertainty, and limited investment options. But as India’s capital markets have deepened and diversified equity fund track records have extended across multiple market cycles, the opportunity cost of blanket conservatism has become increasingly clear and calculable. Our article on what is financial decision making explores the broader framework for improving financial choices in the Indian context.
The Opportunity Cost Formula — How to Calculate It
Calculating opportunity cost requires nothing more than basic arithmetic and honest assumptions about expected returns. The core formula is:
Opportunity Cost = Return on Best Alternative − Return on Chosen Option
Applied to a financial decision over time, this becomes a comparison of future values:
Opportunity Cost = Future Value (Best Alternative) − Future Value (Chosen Option)
For a one-time amount, the future value formula is: FV = PV × (1 + r)^n, where PV is the present value, r is the annual return rate, and n is the number of years.
For a monthly SIP, the future value formula is: FV = P × [((1 + r/12)^(12n) − 1) / (r/12)] × (1 + r/12), where P is the monthly investment and r is the annual return.
Rather than manually applying these formulas, the simplest approach is to use the Financial Decision Calculator on Wealthpedia, which runs both scenarios simultaneously and shows you the rupee difference — your opportunity cost — at the touch of a button. The goal of understanding the formula is not to calculate it by hand but to understand what drives it: the return differential between options, and time. Both matter enormously — which leads directly to the two most powerful insights about opportunity cost in personal finance.
Insight 1: Small rate differences compound into enormous gaps over time. A 3% difference in annual return (say, 7% FD versus 10% equity) on ₹10 lakh over 20 years is not a 60% difference in outcome — it is a 178% difference. At 7%, ₹10 lakh becomes ₹38.7 lakh. At 10%, it becomes ₹67.3 lakh. The opportunity cost of choosing the lower-return option is ₹28.6 lakh — on a single investment of ₹10 lakh.
Insight 2: Opportunity cost is proportional to time. The longer the horizon, the larger the gap. Over 5 years, the same 3% rate differential on ₹10 lakh creates a gap of approximately ₹4.7 lakh. Over 20 years, the gap is ₹28.6 lakh. Over 30 years, it exceeds ₹80 lakh. This is why the opportunity cost of delaying investment — even by a few years — is so dramatically costly.
Six High-Stakes Opportunity Costs Indian Investors Routinely Ignore
These are the most common and financially significant opportunity costs that Indian investors pay without realising it. Each one is quantifiable, and each one can be avoided with the right decision-making process.
Keeping the Emergency Fund in a Savings Account
The emergency fund is the right financial decision — every household needs 6 months of expenses in liquid, accessible form. The error is not having the emergency fund; it is where you keep it.
A savings bank account earns 3–3.5% at most major banks. A liquid mutual fund — equally accessible, with same-day or next-day withdrawal — earns approximately 6.5–7% with a near-identical risk profile. The difference seems small. But on a ₹3 lakh emergency fund maintained over 10 years, the opportunity cost of choosing savings account over liquid fund is approximately ₹1.2 lakh in foregone returns. On ₹6 lakh over 15 years, the gap exceeds ₹3 lakh.
The decision to keep your emergency fund in a liquid fund instead of a savings account costs nothing in terms of safety or accessibility, and saves a meaningful amount over the years. This is perhaps the lowest-effort opportunity cost correction available to Indian households.
Delaying the Start of Your SIP
Time is the most powerful variable in personal finance, and nowhere is its opportunity cost more visible than in delayed investment.
Consider two investors — Amit and Ananya. Both want to retire at 60 with a corpus of ₹2 crore. Both invest in equity mutual funds at 12% CAGR.
Amit starts a SIP at age 25. He needs to invest approximately ₹4,200 per month for 35 years.
Ananya starts at age 35. She needs to invest approximately ₹14,400 per month for 25 years — more than three times as much — to reach the same goal.
The opportunity cost of Ananya’s 10-year delay is not just the compounding she missed. It is the ₹10,200 per month of additional burden she must carry for the rest of her investment journey to catch up to Amit’s outcome. Our article on how much should you invest explores the age-based investment required rate in detail.
Choosing FD Over Equity for Long-Term Goals
Fixed deposits are appropriate financial instruments — for short-term goals (under 3 years), capital preservation needs, and the fixed-income portion of a balanced portfolio. They are not appropriate as the primary vehicle for long-term wealth goals such as retirement or children’s education.
The opportunity cost of an FD-first approach over a 20-year horizon is staggering. ₹10,000 per month invested at 7% FD for 20 years produces approximately ₹52.4 lakh. The same ₹10,000 per month in an equity SIP at 12% CAGR produces approximately ₹98 lakh. The opportunity cost is ₹45.6 lakh — nearly a full second corpus left on the table by choosing safety over appropriate risk for the time horizon.
Prepaying a Low-Interest Home Loan Instead of Investing
Home loan prepayment is emotionally satisfying — being debt-free feels like financial freedom. But when the home loan interest rate is below the realistic long-term return on equity investment, prepayment has a significant opportunity cost.
If your home loan is at 8.5% and equity mutual funds are expected to return 12% CAGR over the same period, every rupee used to prepay the loan instead of investing in equity has a net annual opportunity cost of approximately 3.5% (before accounting for the tax deduction on home loan interest under Section 24(b), which reduces the effective loan cost further). Over a decade, this differential compounds substantially.
Our dedicated article on should you close your loan early models this decision in detail. The key principle: high-interest debt (above 10–12%) should generally be prepaid before investing aggressively in equity. Low-interest debt (below 8%) generally has a positive opportunity cost of prepayment — meaning investing the surplus usually produces better long-term outcomes. Use the Financial Decision Calculator to model your specific loan rate versus expected equity return.
Choosing ULIPs or Endowment Plans Over Term + Mutual Fund
This is arguably the single largest opportunity cost trap in Indian financial products. An endowment policy at age 30 with a ₹1 lakh annual premium and a 20-year term typically delivers a corpus of approximately ₹28–32 lakh — an effective return of roughly 4–6% CAGR. The same ₹1 lakh per year (approximately ₹8,300 per month) invested in equity mutual funds at 12% CAGR produces approximately ₹80–98 lakh over 20 years.
The opportunity cost of the endowment plan versus the term insurance plus equity investment combination is ₹50–70 lakh over 20 years. This is the financial magnitude of choosing a “safe” combination product over separating protection (term insurance, which costs approximately ₹10,000–15,000 per year for ₹1 crore cover at age 30) from investment.
Not Increasing SIP with Income Growth
One of the most underappreciated opportunity costs in Indian financial planning is the failure to step up SIPs in line with income growth. Most salaried professionals receive annual increments of 8–12%. Yet many never increase their monthly SIP amount, because they are already invested and the existing amount feels comfortable.
The opportunity cost of keeping a flat SIP while income grows is enormous. As shown in the Financial Decision Calculator example, a ₹20,000 SIP stepped up by 10% annually for 15 years at 12% CAGR produces ₹1.84 crore — versus ₹1.00 crore for the same SIP kept flat. The opportunity cost of not stepping up: ₹84 lakh. All from the simple habit of reviewing and increasing your SIP annually.
Opportunity Cost and the Time Value of Money
Opportunity cost and the time value of money are deeply connected concepts — so much so that it is difficult to explain one without the other. Our full guide on time value of money covers this in detail, but the core connection is worth establishing here.
The time value of money principle states that a rupee today is worth more than a rupee in the future, because today’s rupee can be invested and earn returns. Opportunity cost is, in essence, the price of violating this principle — the cost of allowing your money to sit in lower-return instruments when better alternatives exist.
When you evaluate two financial options using the Financial Decision Calculator, what the calculator is doing is applying the time value of money to both paths and showing you the compounded future value of each. The difference between those future values is your opportunity cost — quantified in rupees, over your specific time horizon, with your specific return assumptions.
This is also why the opportunity cost of the same decision is dramatically different at different life stages. Investing ₹1 lakh at age 25 versus age 45 has a 20-year difference in compounding runway. At 12% CAGR, ₹1 lakh at 25 grows to ₹52.8 lakh by age 60. The same ₹1 lakh at 45 grows to only ₹9.6 lakh by age 60. The opportunity cost of the 20-year delay — on a single ₹1 lakh investment — is ₹43.2 lakh.
How to Apply Opportunity Cost Thinking to Everyday Decisions
Opportunity cost thinking is a habit, not a one-time calculation. Here is how to build it into your regular financial decision-making process.
Before any large purchase, ask: what is the investment alternative? When evaluating a ₹3 lakh car upgrade, ask what ₹3 lakh invested in equity mutual funds would be worth in 10 years (approximately ₹9.3 lakh at 12% CAGR). That is not a reason to never spend money — it is a reason to spend consciously, with an understanding of the financial trade-off you are making.
Before parking cash in any account, ask: is there a better home for this money at the same risk level? Savings account versus liquid fund is the clearest example. FD versus short-duration debt fund is another. Within the same risk tier, you should almost always be in the higher-yielding instrument.
Before prepaying any loan, compare the loan interest rate to your expected investment return. If your loan rate is below your expected investment return, prepayment has a positive opportunity cost. Model it with the Financial Decision Calculator before deciding.
Review your financial health quarterly. The Financial Health Score tool identifies where your money is currently sitting versus where it should be — making opportunity costs visible across your entire financial life, not just on individual decisions.
Set annual SIP step-up reminders. Every year at your increment time, increase your SIP by at least the percentage of your salary increase. This single habit eliminates one of the largest consistent opportunity costs in Indian wealth building.
Opportunity Cost Is Not the Only Variable — When Lower Returns Are the Right Choice
A nuanced understanding of opportunity cost requires acknowledging when the “lower return” option is actually the correct choice.
Opportunity cost is a financial measure. It does not capture liquidity needs, risk tolerance, emotional peace of mind, or life stage appropriateness. There are many situations where the lower-return option is genuinely the right choice, and recognising them is part of sophisticated financial decision making.
For goals within 3 years, the opportunity cost of choosing debt over equity is real but small — and the risk of equity’s short-term volatility is genuinely higher than the return gain justifies. Choosing a liquid fund or short-duration debt fund over equity for a 2-year goal is not a poor decision; it is an appropriate one.
For the anxiety-prone investor who will panic-sell during a 30% market correction, the psychological cost of equity investment may exceed the financial opportunity cost of a lower-return debt instrument. An FD that keeps you invested is better than an equity fund you exit in a crash.
For people with job insecurity or irregular income, the peace of mind from a larger emergency fund — even earning sub-optimal returns — may be worth its opportunity cost. The Financial Health Score helps you assess your financial resilience before optimising for returns.
Opportunity cost thinking is not about maximising returns at all costs — it is about making deliberate, informed trade-offs. The goal is to never pay an opportunity cost unknowingly, not to eliminate all opportunity costs regardless of context.
Using the Financial Decision Calculator to Quantify Opportunity Cost
The Financial Decision Calculator is the most direct tool available on Wealthpedia for quantifying opportunity costs in real time. Here is how to use it specifically for this purpose.
Enter your current choice as Scenario A — for example, ₹5 lakh in a savings account at 3.5%. Enter your best realistic alternative as Scenario B — for example, ₹5 lakh in a liquid fund at 6.5% or a diversified equity fund at 12% CAGR. Set the time horizon to your planning period — 5, 10, or 20 years. The calculator instantly shows the terminal value of both scenarios and the rupee difference between them. That rupee difference is your opportunity cost — visible, concrete, and motivating.
For ongoing monthly investment decisions, enter both options as monthly SIP amounts. For loan prepayment decisions, use the loan versus invest module, which calculates interest saved on prepayment versus investment corpus built — the net difference being the opportunity cost of one option over the other.
The calculator works alongside the qualitative guidance in each Wealthpedia article. Once you understand the numbers, explore the full decision context — risk dimensions, liquidity considerations, tax implications — in the relevant cluster articles such as SIP vs FD, PPF vs ELSS, or NPS vs PPF.
Frequently Asked Questions
What is opportunity cost in simple terms?
Opportunity cost is the value of what you give up when you make any choice. In personal finance, it is the return or outcome you miss out on by choosing one financial option over the next best alternative. If you put ₹1 lakh in an FD at 7% instead of an equity fund at 12%, your opportunity cost over 10 years is approximately ₹87,000 in foregone returns.
How do I calculate opportunity cost in personal finance?
The simplest method is to calculate the future value of both options and compare them. Future Value = Present Value × (1 + return rate)^years for lump sums. For monthly investments, use the SIP future value formula. Or use the Financial Decision Calculator to do this instantly with your own numbers.
What is the biggest opportunity cost Indians face in personal finance?
Arguably, delaying the start of investing is the single largest opportunity cost. A 10-year delay in starting a ₹10,000 monthly SIP (from age 25 to 35) reduces the 30-year terminal corpus by approximately ₹2.5–3 crore at 12% CAGR. The second largest is keeping long-term savings in low-return instruments like savings accounts, FDs, or endowment plans instead of equity mutual funds.
Does opportunity cost apply to debt repayment decisions?
Yes. Prepaying a low-interest loan (say, a home loan at 8.5%) instead of investing has an opportunity cost equal to the difference between the expected investment return and the loan interest rate, compounded over the remaining loan tenure. If you expect 12% from equity and your loan costs 8.5%, each rupee used for prepayment has an opportunity cost of approximately 3.5% per year — use the Financial Decision Calculator to model the full rupee impact over your specific tenure.
Is opportunity cost a real financial loss?
It is a real economic cost, but not a visible accounting loss. You will never see “opportunity cost: ₹15 lakh” on any bank statement or portfolio report. That invisibility is precisely what makes it dangerous — the costs accumulate silently over years and decades, only becoming apparent when you compare your actual corpus to what it could have been with better decisions.
Can opportunity cost thinking lead to taking too much risk?
It can, if applied simplistically. The solution is to evaluate opportunity cost within the context of risk, time horizon, and liquidity needs — not as a standalone number. A 12% expected return from equity has an opportunity cost advantage over a 7% FD, but that advantage only materialises reliably over 7+ years and comes with interim volatility. For short horizons or low risk tolerance, the “lower return” choice may be genuinely appropriate. Opportunity cost is one input into the decision, not the only one.
How does inflation relate to opportunity cost?
Inflation creates a floor that every financial decision must clear to avoid a real-terms loss. At 6% inflation, a savings account returning 3.5% is not just missing an opportunity cost — it is delivering a negative real return of -2.5% per year. Opportunity cost must always be evaluated in real, inflation-adjusted terms for long-horizon decisions. The SIP calculator with inflation adjustment shows how inflation erodes nominal corpus projections.
What is the opportunity cost of not having an emergency fund?
The opportunity cost of not having an emergency fund is the financial damage caused by being forced to redeem long-term investments prematurely — often at a loss — to cover an unexpected expense. If you liquidate an equity fund during a market downturn to cover a medical emergency, the actual loss (selling low) plus the future compounding foregone on that capital represents the true opportunity cost of the missing emergency fund. This is why building the emergency fund first is a foundational financial decision.
Is there an opportunity cost to paying rent instead of buying a home?
Yes — and there is also an opportunity cost to buying instead of renting. This is one of the most nuanced opportunity cost comparisons in Indian personal finance. Buying commits a large down payment that could otherwise be invested; it also commits you to EMI payments instead of potentially lower rent. Renting frees capital for investment but provides no property appreciation. The buy vs rent comparison and the Financial Decision Calculator can model both sides of this decision with your specific numbers.
How can I start applying opportunity cost thinking today?
Three practical steps: first, check where your savings and emergency fund are currently sitting — if it is a savings account, move it to a liquid mutual fund. Second, run your next major financial decision through the Financial Decision Calculator before committing. Third, check your Financial Health Score to identify the areas of your financial life where the largest opportunity costs are currently hiding.
How does opportunity cost connect to the FIRE movement?
In FIRE planning, opportunity cost is central because every year of delay in reaching financial independence has a calculable cost in additional working years. Conversely, every percentage point of additional savings rate reduces your FIRE timeline in a non-linear way. Our FIRE movement India guide and the Multi-Goal FIRE Planner model these trade-offs comprehensively.
Where can I calculate the opportunity cost of my specific financial decision?
Use the Financial Decision Calculator on Wealthpedia. Enter your current financial choice as Scenario A and your best alternative as Scenario B. The calculator shows the terminal value of both paths over your chosen time horizon — the difference between them is your opportunity cost in rupees.
Disclaimer: The information on this page is for educational purposes only and does not constitute investment or financial advice. Please consult a SEBI-registered financial planner for personalised guidance. Wealthpedia™ (Trademark Reg. No. 4910385) is not a SEBI-registered investment advisor. All mutual fund references on this site are for Direct Plan, Growth option only.

Vishal Jhaveri is the founder of Wealthpedia and an MBA Finance professional with over 10 years of experience in financial planning, investing, and wealth creation. He specializes in FIRE (Financial Independence, Retire Early), retirement planning, investing, and personal finance education. Through Wealthpedia, he develops financial calculators and publishes evidence-based content to help Indian investors make informed financial decisions. He regularly reviews and updates Wealthpedia articles to reflect changes in tax, laws, investment regulations, and personal finance best practices.
Quick Wrap up