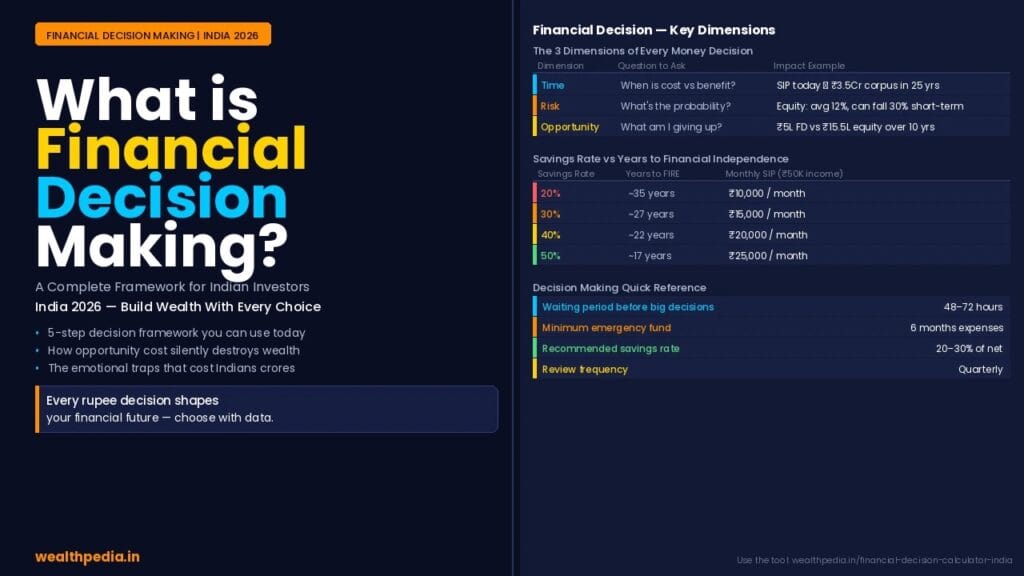

The Financial Decision Calculator is a free, browser-based financial modelling tool built specifically for Indian personal finance decisions. At its simplest, it does one thing extremely well: it takes two financial choices you are weighing — say, investing ₹10,000 per month in an equity mutual fund versus parking it in a fixed deposit — and projects the long-term financial outcome of both paths so you can compare them with hard numbers rather than opinions.
Most Indians make major financial decisions — whether to prepay a home loan, whether to choose SIP over FD, whether to buy or continue renting — by asking friends, reading social media posts, or going by instinct. The problem with all three approaches is they ignore the most important variable in personal finance: time. A decision that looks financially neutral today can create a gap of ₹50 lakh or more over 15 years, depending on which path you chose. The Financial Decision Calculator makes that gap visible before you commit.
The calculator is part of the broader Wealthpedia Personal Finance OS — a suite of interconnected tools designed to give Indian investors the same level of quantitative rigour in their personal financial decisions that they expect from their CA or financial planner, without the cost or the appointment.
It is most useful when you are at a genuine crossroads — when you have two or more options in front of you and need to understand which one will leave you better off financially over a specific time horizon. It is not meant to replace professional financial planning for complex situations, but it is the right first tool to reach for when a financial decision feels uncertain.
Quick Summary
The Financial Decision Calculator is a free online tool on Wealthpedia that helps Indian investors compare two financial scenarios side by side — SIP vs FD, invest vs prepay loan, buy vs rent, lump sum vs EMI — and see the long-term monetary impact of each choice in real numbers. Instead of relying on gut feel or vague advice, the calculator shows you exactly what each decision costs or earns over your chosen time horizon. This guide explains how the tool works, what types of decisions it handles best, how to read its output, and real-world examples using Indian scenarios. Start here: Financial Decision Calculator.
Join Now →
Why a Calculator Beats Intuition for Financial Decisions
Human intuition is poorly calibrated for financial decisions — not because people are unintelligent, but because our brains are wired to evaluate choices based on immediate, concrete outcomes rather than abstract, distant ones. When you compare investing ₹5,000 per month in an equity mutual fund against putting it in a recurring deposit, the FD feels safer and more certain — and in the short run, it is. But over 20 years, the difference in terminal corpus between the two is not marginal. It is transformative. At 12% CAGR versus 6.5% FD returns (post-tax), the equity route produces roughly 3.5× more wealth over 20 years than the FD route on the same monthly investment.
Intuition does not compute compound interest. It does not adjust for inflation. It does not factor in tax drag or the opportunity cost of liquidity. The Financial Decision Calculator does all of this — which is why using it before any major money decision is one of the most impactful financial habits you can build.
This connects directly to the core principle explored in our article on what is financial decision making: good financial decisions are not instinctive — they are structured. A calculator is the simplest structure you can put around a financial choice. It converts a subjective question (“should I invest or prepay?”) into an objective one (“which option produces better outcomes over my specific time horizon, given my numbers?”).
What Decisions Can the Financial Decision Calculator Help With?
The Financial Decision Calculator is designed to handle the most common financial crossroads that Indian investors face. Here is a breakdown of the key decision types it supports.
SIP vs Fixed Deposit
This is among the most frequently asked questions in Indian personal finance. A salaried professional earning ₹80,000 per month wants to invest ₹15,000 monthly. Should it go into an equity mutual fund via SIP at an expected 12% CAGR, or into a fixed deposit at 7%? The calculator shows both projected corpus values over the chosen tenure — say, 15 or 20 years — along with the rupee difference. It also factors in the post-tax return on the FD (fully taxable at slab rate) versus the LTCG advantage on equity funds (10% on gains above ₹1.25 lakh per year). For any tenure above 7 years, equity SIP typically dominates significantly — but the calculator shows you exactly by how much, with your own numbers.
Invest vs Prepay Home Loan
One of the most contested decisions in Indian personal finance: you have surplus funds of, say, ₹3 lakh. Should you prepay your home loan at 9% interest, or invest the money in equity mutual funds? The answer is not as obvious as it seems, and it depends on the loan tenure remaining, your tax bracket, and the realistic return on your chosen investment. The calculator models both paths and computes the net financial benefit of each, accounting for interest saved on the loan versus expected investment corpus.
Buy vs Rent
Buying a home or continuing to rent is a deeply emotional decision for most Indian families — but it also has a clear financial dimension. If you invest the down payment you would have made and continue renting, how does your net wealth compare to buying a property at the same price over a 10-year horizon? The calculator models both scenarios — rental outflow versus EMI, down payment as investment corpus, property appreciation — and gives a comparable net worth figure at the end of the chosen period.
Lump Sum vs EMI
You are buying a car or appliance. You can pay ₹8 lakh upfront from your savings, or pay a ₹2 lakh down payment and finance the balance at 10% interest via EMI over 4 years. The calculator shows the total cost of the EMI route versus the opportunity cost of deploying the lump sum — and helps you make a rational decision rather than defaulting to the EMI simply because it reduces the immediate cash outflow.
Old vs New Tax Regime
This is a newer feature for Indian investors — the choice between the old and new income tax regimes has significant impact on how you structure your investments, particularly for salaried individuals. The calculator models your tax liability under both regimes based on your income and deductions, showing you the net savings or cost of switching.
SIP Step-Up Analysis
How much more corpus do you accumulate if you increase your SIP by 10% annually versus keeping it flat? The calculator models the step-up SIP versus flat SIP outcomes over a long horizon and shows the compounding impact of even a modest annual increase — a feature that is especially motivating when you see the numbers.
How to Use the Financial Decision Calculator — Step by Step
Using the Financial Decision Calculator is designed to be straightforward, even if you are not familiar with financial modelling. Here is a practical walkthrough.
Step 1: Choose Your Decision Type
Open the calculator and select the type of decision you want to model. The tool is categorised by decision type — investing decisions, loan decisions, tax decisions, and so on. Selecting your decision type loads the relevant input fields.
Step 2: Enter Your Numbers
Fill in the input fields with your actual numbers. For an SIP vs FD comparison, this means: the monthly investment amount, the expected SIP return (typically 10–12% for diversified equity funds based on long-term Indian market history), the FD interest rate (check current rates at your bank), your tax slab (for post-tax FD return calculation), and the investment tenure in years.
Use realistic numbers here, not optimistic ones. A 15% expected return on equity looks attractive but is not a reliable planning assumption over a 20-year period. The standard benchmark used in Indian financial planning is 10–12% CAGR for diversified equity mutual funds. Our article on SIP returns and historical performance in India provides the data behind this assumption.
Step 3: Run the Comparison
Click Calculate. The tool instantly generates a side-by-side comparison showing the projected corpus or outcome for each scenario at the end of your chosen tenure. For investment comparisons, you will see the final corpus, total invested amount, and total returns for both options. For loan decisions, you will see total interest paid, interest saved, and net financial position under each option.
Step 4: Adjust and Explore Scenarios
The calculator is interactive — you can change variables and see results update immediately. This is its most powerful feature. Try increasing the tenure from 10 to 15 years and watch how the equity SIP advantage grows dramatically due to compounding. Try changing the FD rate from 7% to 6.5% to see how rate changes affect the outcome. Try adjusting the EMI tenure on a loan from 20 to 15 years to see interest savings. This exploration reveals the sensitivity of the decision to different variables — which builds genuine financial insight rather than just a single number.
Step 5: Make Your Decision with Confidence
With the comparison in front of you, the decision typically becomes clearer. You may find that the financially superior option is obvious — the numbers are decisive. Or you may find the outcomes are relatively close, in which case non-financial factors (liquidity preference, risk tolerance, family considerations) become the tiebreaker — but at least you know the financial dimension is not the reason to choose one over the other.
Reading the Calculator Output — What the Numbers Mean
Understanding what the calculator is telling you is as important as knowing how to use it. Here are the key output metrics and what they mean in practice.
Final Corpus / Terminal Value
This is the projected value of your investment or savings at the end of the chosen tenure. It accounts for compounding — meaning it reflects not just your contributions, but the returns earned on previous returns. A monthly SIP of ₹10,000 at 12% CAGR for 20 years produces a terminal value of approximately ₹98 lakh — not ₹24 lakh (which would be the simple sum of contributions). That gap of ₹74 lakh is the power of compounding made visible.
Total Invested vs Total Returns
The calculator breaks down the terminal value into how much you actually invested (total contributions) and how much came from investment returns. For long tenures at higher return rates, total returns from compounding frequently exceed total invested capital — sometimes by 3× or more. This visual breakdown is one of the most compelling arguments for starting to invest early and staying invested long.
Rupee Difference Between Options
The calculator shows the absolute rupee difference between your two scenarios. If the equity SIP route produces ₹98 lakh and the FD route produces ₹56 lakh over 20 years on the same monthly investment, the difference is ₹42 lakh. That is your opportunity cost of choosing FD over SIP — a concrete, motivating number that no amount of intuitive reasoning would have surfaced.
Inflation-Adjusted Value
For long-horizon decisions, the calculator optionally shows the real, inflation-adjusted value of the projected corpus. At 6% inflation, ₹98 lakh in 20 years has the purchasing power of approximately ₹31 lakh today. This adjustment is critical for retirement planning — it prevents the common mistake of treating a large nominal corpus as automatically sufficient. Our detailed article on inflation and financial decisions covers why inflation-adjusted projections matter so much for Indian investors.
Real-World Examples Using the Calculator
Nothing illustrates the value of the Financial Decision Calculator better than concrete Indian scenarios. Here are three examples using realistic numbers.
Example 1 — Rahul, 32, Bengaluru: SIP vs FD on ₹15,000/month for 20 years
Rahul has ₹15,000 per month to invest. His options are: a diversified equity mutual fund SIP (expected 12% CAGR) or a bank FD at 7% (post-tax return approximately 4.9% at 30% slab). Running this through the calculator:
- Equity SIP at 12% for 20 years: ₹1.49 crore terminal corpus
- FD at 4.9% post-tax for 20 years: ₹62 lakh terminal corpus
- Rupee advantage of equity SIP: ₹87 lakh
That ₹87 lakh gap is the financial cost of choosing the “safe” FD option. It is not a small number. It is a house down payment, or a child’s higher education fund abroad, or a decade of early retirement.
Example 2 — Priya, 38, Mumbai: Invest ₹5 lakh Surplus vs Prepay Home Loan
Priya has received a bonus of ₹5 lakh. Her home loan outstanding is ₹45 lakh at 8.5% interest with 12 years remaining. She can either prepay ₹5 lakh or invest it in equity mutual funds.
- Prepaying ₹5 lakh saves approximately ₹6.8 lakh in total interest over the remaining tenure (depending on the prepayment timing relative to the amortisation schedule)
- Investing ₹5 lakh in equity at 12% CAGR for 12 years grows to approximately ₹19.4 lakh
The calculator makes visible what many people miss: at an 8.5% loan rate, the financial opportunity cost of prepaying versus investing in equity (at an expected 12% CAGR) is approximately ₹12.6 lakh over 12 years. For someone in a high tax bracket who also gets home loan interest deduction under Section 24(b), the after-tax cost of the loan is even lower — making the investment case even stronger. Our article on should you close your loan early digs into this trade-off comprehensively.
Example 3 — Vikram, 45, Ahmedabad: Step-Up SIP vs Flat SIP
Vikram can invest ₹20,000 per month in equity mutual funds for 15 years until retirement. He can either keep the SIP flat or increase it by 10% every year as his income grows.
- Flat SIP ₹20,000 at 12% for 15 years: ₹1.00 crore
- Step-up SIP (10% annual increase) starting at ₹20,000 for 15 years: ₹1.84 crore
- Additional corpus from step-up: ₹84 lakh
That extra ₹84 lakh comes from a habit of increasing the SIP by just 10% annually — roughly in line with typical salary increments. The calculator makes this concrete and motivating in a way that a general statement like “increase your SIP regularly” never would.
How the Financial Decision Calculator Connects to Your Overall Financial Plan
The Financial Decision Calculator does not work in isolation — it is most powerful when used as part of a broader financial planning process. On Wealthpedia, it connects naturally to several complementary tools.
Start by checking your Financial Health Score — it tells you which areas of your financial life need the most attention right now, and helps prioritise which decisions to model first. If your emergency fund is underfunded, that decision takes priority over optimising between SIP and FD.
Once you know which decisions matter most, use the Financial Decision Calculator to model them with your actual numbers. Then use the Multi Goal FIRE Planner to see how your individual decisions feed into your overall retirement and financial independence timeline.
For retirement-specific modelling, the Retirement Corpus Calculator shows how much you need to accumulate, and the Safe Withdrawal Rate Calculator shows how much you can sustainably withdraw once you retire. Together, these tools form a complete decision-support system for every stage of your financial life — from the first investment at 25 to the decumulation strategy at 60.
The calculator also complements the knowledge content on Wealthpedia. Before modelling SIP vs FD, read the SIP vs FD comparison article to understand the qualitative dimensions — risk, liquidity, tax efficiency — that the calculator quantifies. Before modelling invest vs prepay, read home loan vs rent to understand the full picture of property-versus-investment decisions in the Indian context.
Common Mistakes When Using Financial Calculators
Even the best calculator gives poor output if you feed it poor inputs. Here are the most common mistakes Indian investors make when using financial decision calculators — and how to avoid them.
Using optimistic return assumptions. The biggest mistake is assuming 15–18% equity returns because that is what a friend’s portfolio did last year, or what a recent NFO claimed. Long-term diversified equity fund returns in India have averaged 10–12% CAGR over 15–20-year periods. Plugging in 15% makes your equity corpus look dramatically better than realistic — which leads to false confidence and underinvestment. Always use 10–12% for diversified equity in long-horizon planning.
Ignoring tax. Comparing pre-tax FD returns (7%) against pre-tax equity returns (12%) overstates the FD’s competitiveness. FD interest is taxed at your slab rate annually — effectively 30% for most salaried professionals in the higher brackets. Equity LTCG is taxed at 10% on gains above ₹1.25 lakh per year, and only at redemption. Always use post-tax returns in both scenarios for a fair comparison.
Short time horizons. The Financial Decision Calculator’s output becomes more decisive over longer time horizons because compounding has more time to create divergence between scenarios. If you model SIP vs FD over 3 years, the difference is modest. Over 20 years, it is life-changing. Always model the full realistic time horizon of the decision, not a short window that understates the compounding effect.
Not adjusting for inflation. A corpus of ₹2 crore in 2045 is not the same as ₹2 crore today. Always use the inflation-adjusted value output — especially for retirement planning. At 6% inflation, today’s ₹2 crore is worth roughly ₹62 lakh in real terms 20 years from now.
Ignoring liquidity. The calculator projects terminal values, but does not automatically flag that equity SIPs involve market risk and may require you to stay invested during drawdowns. FDs, while lower-returning, offer more predictable access to capital. For money you may need within 3–5 years, equity is genuinely not appropriate — regardless of what the 20-year projection shows.
Frequently Asked Questions
What is the Financial Decision Calculator on Wealthpedia?
The Financial Decision Calculator is a free online tool that compares two financial scenarios side by side — for example, SIP vs FD, invest vs prepay loan, or buy vs rent — and projects the long-term financial outcome of each choice using your actual numbers. It is designed specifically for Indian personal finance decisions.
Is the Financial Decision Calculator free to use?
Yes. The calculator is completely free. No registration, subscription, or account creation is required. You can access it directly at wealthpedia.in/financial-decision-calculator-india.
What types of financial decisions can the calculator help with?
The calculator handles the most common Indian personal finance crossroads: SIP vs FD, invest vs prepay home loan, buy vs rent, lump sum vs EMI, flat SIP vs step-up SIP, old vs new tax regime, and more. It models any scenario where you need to compare two financial paths over a defined time horizon.
What return rate should I use for equity mutual funds in the calculator?
Use 10–12% CAGR for long-horizon diversified equity fund planning. This is consistent with the 15–20 year historical performance of Indian large-cap and diversified equity mutual funds. For more conservative planning, use 10%. For aggressive scenarios, 12% is a reasonable upper bound. Avoid using recent short-term performance as a planning assumption.
Does the calculator account for inflation?
Yes. The calculator has an inflation adjustment feature that converts the projected nominal corpus into real, purchasing-power-adjusted terms. This is particularly important for retirement planning — always view the inflation-adjusted output alongside the nominal figure for long-horizon decisions.
Can I use the calculator to decide between the old and new tax regime?
Yes. The calculator includes a tax regime comparison module that models your income tax liability under both the old and new regimes based on your income, standard deduction, and declared deductions under Section 80C, 80D, and HRA. The output shows you the net tax savings or cost of each choice. See also our detailed old vs new tax regime article.
How accurate are the calculator’s projections?
The calculator uses standard financial mathematics — compound interest, SIP future value formula, EMI amortisation — which are precise given the inputs you provide. The accuracy of the projections depends on the accuracy of your assumptions, particularly the expected return rate. The calculator produces a projection, not a guarantee. Actual returns will vary based on market performance, interest rate changes, and other factors.
Should I use the Financial Decision Calculator before every financial decision?
For any financial decision involving more than ₹1 lakh or a time horizon of more than 1 year, yes — running the numbers through the calculator before committing is a valuable habit. For smaller or shorter-horizon decisions, a quick mental calculation typically suffices. The goal is to ensure that the financial dimension of important choices is understood quantitatively, not just intuitively.
How does the Financial Decision Calculator differ from a standard SIP calculator?
A standard SIP calculator projects the future value of a single SIP — it answers the question “how much will my SIP be worth in N years?” The Financial Decision Calculator compares two scenarios simultaneously — it answers the question “which of these two financial choices leaves me better off, by how much, and over what horizon?” It is a decision-support tool, not just a projection tool.
What should I do after I get the calculator results?
Use the results as the starting point for your decision, not the end point. Check your Financial Health Score to see whether this decision fits into your overall financial priorities. Read the corresponding Wealthpedia article for qualitative context — for example, SIP vs FD or invest vs prepay — to understand the risk, liquidity, and tax dimensions that the calculator quantifies but does not explain. Then make your decision with both the numbers and the full context in hand.
Can the calculator help me plan for FIRE (Financial Independence, Retire Early)?
The Financial Decision Calculator is one of several tools on Wealthpedia that support FIRE planning. For dedicated FIRE modelling, use the Multi-Goal FIRE Planner and early retirement calculator. The Financial Decision Calculator is best used to optimise individual decisions within your FIRE plan — for example, whether to invest aggressively in equity or diversify into debt as you approach your FIRE target date.
Where can I find more guidance on making better financial decisions?
Start with our core guide on what is financial decision making for the foundational framework. Then explore the specific decision articles in this cluster — opportunity cost in personal finance, time value of money, emotional vs rational decisions — for deeper coverage of the principles behind every financial decision you will ever make.
Disclaimer: The information on this page is for educational purposes only and does not constitute investment or financial advice. Projections produced by the Financial Decision Calculator are based on the assumptions you input and are not guaranteed outcomes. Please consult a SEBI-registered financial planner for personalised guidance. Wealthpedia™ (Trademark Reg. No. 4910385) is not a SEBI-registered investment advisor. All mutual fund references on this site are for Direct Plan, Growth option only.

Vishal Jhaveri is the founder of Wealthpedia and an MBA Finance professional with over 10 years of experience in financial planning, investing, and wealth creation. He specializes in FIRE (Financial Independence, Retire Early), retirement planning, investing, and personal finance education. Through Wealthpedia, he develops financial calculators and publishes evidence-based content to help Indian investors make informed financial decisions. He regularly reviews and updates Wealthpedia articles to reflect changes in tax, laws, investment regulations, and personal finance best practices.
Quick Wrap up