Your company just credited ₹1.2 lakh as an annual bonus. You know it should go into mutual funds. But now comes the question that trips up most investors: do you invest it all today, or break it into monthly instalments? The answer is not what most personal finance content will tell you — and Indian market data from 23 years of Nifty 50 rolling returns makes the case better than any opinion.
The ₹1.2 Lakh Question
Priya gets her annual bonus — ₹1.2 lakh. She opens her mutual fund app and faces the classic fork: invest everything now (lump sum) or invest ₹10,000/month for 12 months (SIP)?
Her colleague Rohan says: “Markets are high. Stagger it.”
Her manager says: “Time in the market beats timing the market. Invest everything today.”
The internet says: “SIPs are always better because of rupee cost averaging.”
All three are partially right. All three are dangerously incomplete.
The honest answer to Priya’s question depends on five variables she has not yet considered: current market valuation, her investment horizon, her ability to hold through a drawdown, whether the funds are sitting idle in savings meanwhile, and — most importantly — whether the lump sum vs SIP framing even applies to her situation.
This article settles the debate with data: 23 years of Nifty 50 rolling returns, 704 rolling windows, real XIRR analysis, and the complete STP framework that resolves the tension between lump sum and SIP for windfalls. By the end, you will know exactly which approach fits your specific situation — not a generic answer, but a framework.
Before diving in, note that the SIP Comparison Calculator lets you model both lump sum and SIP scenarios side by side with actual numbers — use it to validate the specific decision you are making.
Quick Summary
The SIP vs lump sum debate has a data-backed answer — but it is not the one most people expect. Analysis of 23 years of Nifty 50 rolling returns (704 windows) shows SIP wins 52% of 5-year periods while lump sum wins 52% of 15-year periods. Neither dominates. For monthly salary: always SIP. For windfalls in normal markets: STP (Systematic Transfer Plan) is optimal — earning 6.5–7% in liquid fund while phasing equity entry. For windfalls during market crashes (down 20%+): deploy as lump sum immediately. Most importantly, the annual step-up rate on your SIP matters 13× more than the deployment method decision.
Part 1: The Core Concepts — Definitions That Matter
What is a Lump Sum Investment?
A lump sum investment deploys a single amount into a mutual fund in one transaction. You invest ₹5 lakh today and receive units at today’s NAV. Your entire capital is immediately exposed to market movements from Day 1.
When lump sums arrive naturally: Annual bonus, performance incentive, Diwali gift, maturity of FD or NSC, property sale proceeds, inheritance, EPF withdrawal, gratuity, freelance project payment, tax refund.
The lump sum advantage: Every rupee is invested and compounding immediately. In a rising market, earlier deployment means more time for compounding. Mathematically, if markets go up from the day you invest, lump sum always wins over SIP — because you bought everything at the lower price.
The lump sum risk: If markets fall 30% in the two weeks after you invest, you experience the full loss on your entire capital. Psychologically, this is devastating for most investors — and leads to panic-selling at exactly the wrong moment.
What is a SIP?
A SIP (Systematic Investment Plan) invests a fixed amount at regular intervals — typically monthly — regardless of market levels. You invest ₹10,000 on the 5th of every month, buying however many units that amount purchases at the prevailing NAV.
The SIP advantage: Rupee cost averaging. When markets fall, you buy more units. When markets rise, you buy fewer. Over time, the average cost per unit is lower than the average of the NAVs — creating a built-in buying advantage during volatile markets.
The SIP reality check: SIP does not “average” in a rising market — in a steadily rising market, you are buying fewer and fewer units every month as NAV climbs. The rupee cost averaging benefit only materialises in volatile or falling-then-rising markets.
As explored in the best SIP allocation strategy, the real advantage of SIP for most Indians is not mathematical — it is behavioural. SIP makes investing automatic, eliminates timing decisions, and creates a discipline habit that most investors cannot maintain with discretionary lump sum investing.
What is an STP (Systematic Transfer Plan)?
An STP is the bridge between lump sum and SIP. You park a lump sum in a liquid fund (or money market fund) and set up an automatic monthly transfer to an equity fund.
Example: Priya receives ₹1.2 lakh bonus. She puts it in a liquid fund today (earning ~7% annual return). She sets up an STP of ₹10,000/month to a Nifty 50 index fund for 12 months.
The STP gives her:
- The lump sum’s advantage: money starts earning immediately (in the liquid fund) rather than sitting in a savings account at 3–4%
- The SIP’s advantage: equity exposure is phased, reducing timing risk
This is why the STP is not a compromise — it is a genuinely superior strategy for windfall deployment, and we cover it in full in Part 4.
Part 2: What 23 Years of Nifty 50 Data Actually Shows
This is the section that most SIP vs lump sum articles skip — because the data is more nuanced than either camp wants to admit.
A comprehensive rolling returns analysis of 23 years of Nifty 50 data (March 2002 to December 2025) tested 704 rolling windows across 5-year, 7-year, 10-year, and 15-year periods, comparing SIP XIRR against lump sum CAGR for identical deployment amounts. The findings challenge both the “SIP always wins” and “lump sum always wins” camps.
The Headline Finding: It Is Essentially a Coin Flip at 5 Years
Across all 5-year rolling windows:
- SIP won 52% of periods
- Lump sum won 48% of periods
At 5 years, neither approach dominates. The winner is determined almost entirely by market conditions in that specific 5-year window — not by the method itself.
Lump Sum Gains an Edge at Longer Horizons
Across all 15-year rolling windows:
- Lump sum won 52% of periods
- SIP won 48% of periods
The shift is modest but consistent: as the horizon lengthens, lump sum’s “money in the market sooner” advantage accumulates. Over 15 years, starting with more capital deployed compounds to a meaningful advantage.
The Most Important Data Point: SIP’s Floor Protection
The worst 10-year SIP XIRR on Nifty 50 from 2002–2025 was approximately 8.5% — for an investor who started at the peak of the 2000 dot-com bubble.
The worst 10-year lump sum CAGR? For someone who invested at the 2008 pre-crisis peak: approximately 4.8% — barely inflation-beating.
This asymmetry is the entire argument for SIP. The floor is higher. An investor who started a Nifty 50 SIP at the peak in October 2021 (before the 2022 correction) still generated an XIRR of approximately 11–13% by 2024. A lump sum investor on the same date earned approximately 6–7.5% CAGR.
The Key Conclusion from the Data
For regular monthly income (salary): SIP wins — not because it is mathematically superior but because it is the only practical option and it eliminates timing risk entirely. 94% of 10-year SIP investments on Nifty 50 generated positive XIRR returns.
For lump sums in steadily rising markets: Lump sum wins — because all capital compounds from Day 1.
For lump sums in uncertain or high-valuation markets: STP wins — capturing the liquid fund return on waiting capital while phasing equity entry.
Over 20+ years: The method matters less than consistency. A 2025 study on 22 years of Nifty 50 data found that over 20-year horizons, SIP vs lump sum outcomes converge significantly. Strategy matters 13× more than method — which funds, which allocation, which step-up rate — versus whether you entered as SIP or lump sum.
Part 3: The Decision Framework — Which Method for Which Situation
Situation 1: Monthly Salary Investor
Always SIP. No debate.
A salaried professional receives income monthly. There is no “lump sum vs SIP” question — the monthly SIP is the only rational approach. Every month’s salary produces a new small investment.
The relevant questions are: how much, in which funds, with what step-up, across which goals. As explored in the SIP planning for 30-year-olds guide, these allocation and step-up decisions matter far more than SIP vs lump sum.
Use the SIP Comparison Calculator to model different monthly amounts and step-up rates — the variable that creates the largest corpus difference for salaried investors is not SIP vs lump sum but step-up rate vs flat SIP.
Situation 2: Annual Bonus (₹50,000 to ₹5 lakh)
Use STP over 6–12 months.
Annual bonuses are the most common lump sum event for Indian salaried professionals. The STP approach is optimal:
- Credit the bonus to a liquid fund immediately (do not let it sit in savings earning 3%)
- Set up STP of bonus ÷ 6 or ÷ 12 months to your equity fund
- STP auto-executes — no monthly manual decision required
Why not straight lump sum for a bonus? Psychologically, a bonus feels like a “windfall” — losing 20% of it in a market correction feels disproportionately painful compared to losing 20% of a monthly salary installment. The STP removes this psychological exposure while keeping the money productive.
Why 6 months vs 12 months? For smaller bonuses (under ₹2 lakh): 6-month STP. For larger bonuses (₹2–5 lakh): 12-month STP. Beyond ₹5 lakh, the lost opportunity cost of keeping money in liquid fund for 12 months starts to matter — consider 6–9 months.
Situation 3: Large Windfall (₹10 lakh to ₹1 crore)
Use STP over 12–24 months, with market valuation as the calibration variable.
Large windfalls — property sale proceeds, inherited wealth, EPF withdrawal, large business payout — require more structured planning.
The Nifty P/E calibration approach: Nifty 50 P/E Ratio Market Condition STP Duration Recommended Below 18 Cheap / undervalued 6 months or even lump sum 18–22 Fair value range 12 months STP 22–26 Moderately expensive 18 months STP Above 26 Expensive / elevated 24 months STP
As of June 2026, the Nifty 50 P/E is approximately 22–24× — in the moderately expensive range — suggesting a 18-month STP is appropriate for large windfall deployment.
Important: During the STP period, the waiting capital earns 6.5–7% in the liquid fund. A ₹50 lakh windfall in a liquid fund for 18 months earns approximately ₹4.9–5.25 lakh in interest — not nothing. The STP is not “sitting on the sidelines.” It is earning while transitioning.
Situation 4: Market Crash / Deep Correction (Nifty Down 20%+)
Deploy as lump sum immediately. This is the one scenario where lump sum decisively wins.
When markets have corrected 25–35% from their peak — as they did in March 2020 (COVID), December 2011, March 2009 — deploying a lump sum immediately captures the maximum recovery upside.
The data is clear: the Nifty 50 in March 2020 fell to 7,511. By March 2021, it was at 14,690 — a 96% recovery in 12 months. An investor who deployed ₹5 lakh as a lump sum in March 2020 had ₹9.8 lakh in March 2021. An investor who STped over 12 months had approximately ₹7.8 lakh — still excellent, but ₹2 lakh less.
The crash deployment rule: If the market has fallen more than 20% from its 52-week high, stop the STP and deploy the remaining liquid fund balance as a lump sum into equity immediately. This is the one scenario where the data unambiguously favours immediate deployment.
Situation 5: Retirement Corpus Withdrawal Reinvestment
Never lump sum. SIP-equivalent systematic withdrawal only.
For retirees who receive lump sums (PPF maturity, FD maturity, EPF balance) and want to reinvest in equity for corpus sustainability, the STP is essential. A retiree cannot afford to deploy a significant lump sum into equity right before a 40% crash.
As detailed in the retirement withdrawal strategy, the bucket system handles this: park lump sum proceeds in Bucket 2 (stable instruments) and transfer to Bucket 3 (equity) systematically — which is functionally identical to an STP.
Part 4: The Complete STP Guide — Implementation Step by Step
What is the Ideal STP Setup?
An STP requires three components:
- Source fund (liquid fund): Where the lump sum is initially parked. This earns 6.5–7% annually while waiting.
- Target fund (equity fund): Where money transfers monthly. Typically your Nifty 50 or mid-cap index fund.
- STP instruction: Amount and frequency (monthly recommended) for the auto-transfer.
Most major AMCs and platforms (Zerodha Coin, Groww, MFCentral, Kuvera) support STP with a single instruction that auto-executes without monthly intervention.
Step-by-Step STP Implementation
Step 1: Receive lump sum (bonus, windfall, maturity proceeds).
Step 2: Invest entire amount in a liquid fund from the same AMC as your target equity fund. (Intra-AMC STP is smoother; inter-AMC STP is possible but takes 1–2 extra days per transaction.)
Step 3: Check current Nifty 50 P/E. Determine STP duration using the calibration table above.
Step 4: Set up STP instruction: Fixed amount = Lump sum ÷ Number of months. Target = your equity index fund.
Step 5: Leave it running. Do not interfere — even if markets fall (you are buying more units with each transfer) or rise (your liquid fund NAV is still earning).
Step 6: On crash alert (Nifty down 20%+): manually close the remaining STP and deploy the liquid fund balance as a lump sum into equity.
STP vs SIP: Are They the Same Thing?
Functionally similar, structurally different.
- SIP: New money invested every month from income
- STP: Existing invested money (in liquid fund) transferred every month to equity
The key difference: in SIP, money is idle in your bank account between salary credit and investment. In STP, money is already invested (in liquid fund) and earning return while awaiting equity deployment.
For someone receiving a ₹5 lakh windfall, STP is superior to SIP because the ₹5 lakh is earning 6.7% from Day 1 in the liquid fund — not earning 3–4% in savings while you process 5 monthly SIP transfers.
Part 5: The Rupee Cost Averaging Reality Check
Does Rupee Cost Averaging Actually Work?
The honest answer: It depends on the market environment.
In volatile markets (India’s normal state): RCA works beautifully. When the Nifty falls 20% and you continue buying, your average cost per unit is lower than an investor who bought the same average-priced lump sum. The 2018–2020 volatile period and 2022 correction year are examples where SIP investors significantly outperformed lump sum investors who had deployed at the 2021 peak.
In steadily rising markets: RCA works against you. In 2020–2021 when the Nifty ran from 8,000 to 18,000 with few corrections, every monthly SIP bought units at a higher price than the previous month. A lump sum investor who deployed at Nifty 8,000 in April 2020 doubled their money by December 2021. An SIP investor who staggered entry over 12 months averaged approximately Nifty 12,000 — capturing less of the bull run.
The honest data: The Nifty 50 Annual Returns show the extent of volatility:
- 2008: −52%, 2009: +76% — massive SIP advantage (buying at 2008 lows)
- 2020: −24% (March), +86% (April 2020 to March 2021) — lump sum at the bottom was optimal
- 2022: −7%, 2023: +20% — mild correction, SIP advantage modest
The core insight: RCA is most valuable precisely when it is most psychologically difficult to implement — during prolonged corrections when investors most want to pause. The data on this is unambiguous: investors who stopped SIPs during March 2020 missed the fastest recovery in Indian equity market history.
Part 6: Three Complete Real-Money Scenarios
Scenario 1: Ananya, 29, Software Engineer, Bengaluru — ₹1.5 Lakh Annual Bonus
Situation: Monthly SIP of ₹15,000 already running in Nifty 50. Received ₹1.5 lakh bonus. Markets at moderate valuation (P/E ~23).
Option A — Lump Sum: Invest ₹1.5 lakh immediately in Nifty 50.
Option B — STP: Park ₹1.5 lakh in HDFC Liquid Fund, set STP of ₹12,500/month for 12 months to Nifty 50.
Option C — Add to monthly SIP: Increase existing SIP from ₹15,000 to ₹27,500 for 12 months (essentially manually creating a SIP with the bonus).
Analysis over 12 months (illustrative, moderate market scenario):
- Option A (Lump Sum): ₹1.5 lakh × 1.10 = ₹1.65 lakh (assuming 10% annual return, moderate market)
- Option B (STP): Liquid fund earns ~₹8,000 over 12 months on average balance. Equity exposure phased — slightly lower corpus in rising market. Net: ₹1.62–1.65 lakh
- Option C (Enhanced SIP): Functionally equivalent to Option B but with idle bank account exposure for 6 months of the money
Verdict for Ananya: Option B (STP) — captures liquid fund return on full ₹1.5 lakh from Day 1, phases equity entry at moderate valuations, and requires zero manual monthly action.
In a crash scenario (Nifty falls 25% mid-year): On crash detection, Ananya closes the STP and deploys the remaining ₹75,000 liquid fund balance as a lump sum into Nifty 50 at the bottom. This converts the STP into a tactical lump sum deployment — the best of both approaches.
Scenario 2: Vikram, 44, Finance Manager, Mumbai — ₹18 Lakh FD Maturity
Situation: ₹18 lakh FD matured. Wants to move from FD to equity as part of retirement portfolio rebalancing. Has 16 years to retirement.
Option A — Lump Sum into equity:
At Nifty P/E of ~23, deploying ₹18 lakh immediately. If market falls 30% in Year 1: corpus drops to ₹12.6 lakh. Recovers over 2–3 years, but the psychological impact is severe for Vikram who is not accustomed to equity volatility.
Option B — 18-month STP:
Park ₹18 lakh in liquid fund. STP ₹1 lakh/month for 18 months into Nifty 50 + Mid Cap Index split.
- Liquid fund earns approximately ₹1.02 lakh in interest over 18 months
- Equity exposure builds gradually — maximum exposure at end of STP
- If market corrects mid-STP: buys more units at lower prices
The behavioural advantage for Vikram: Even if Option A produces marginally higher final corpus (50% probability based on rolling data), the probability that Vikram panic-sells after a 30% crash on his entire ₹18 lakh is much higher than the probability he panic-sells during an STP where only ₹6–8 lakh is in equity at any given time.
The liquidation cost of panic-selling: Vikram exits at Nifty 8,000 (post-crash), repurchases at 12,000 (recovery) — this single emotional decision costs more than the entire theoretical difference between lump sum and STP over 16 years.
Verdict for Vikram: 18-month STP. At his risk profile and entry capital size, the STP’s psychological protection from premature exit is worth more than the marginal mathematical advantage of immediate lump sum deployment.
Scenario 3: Preethi, 52, Returning NRI — ₹75 Lakh Repatriation
Situation: Preethi is returning from UAE after 18 years. Has ₹75 lakh to deploy into Indian equity for retirement planning (target retirement at 62, 10 years away).
The complexity: This is a large amount, 10-year horizon, first Indian equity investment — no experience holding through Indian market crashes.
The only rational approach: 24-month STP with Nifty P/E calibration.
- ₹75 lakh in liquid fund earning ₹4.9–5.25 lakh over 24 months in interest
- STP ₹3.125 lakh/month for 24 months into diversified portfolio (Nifty 50 + Nifty Next 50 + BAF)
- Total equity deployed by end of 24 months: ₹75 lakh (same as lump sum) but with much more stable average entry price
The return comparison on ₹75 lakh:
| Approach | Liquid Fund Earnings (24 Months) | Equity Return (12% on Deployed Amount) | Estimated Total at 24 Months |
|---|---|---|---|
| Lump Sum (Immediate) | ₹0 | ₹18 lakh (12% on full ₹75L for 2 yrs) | ₹93 lakh |
| STP (24 Months) | ₹4.9 – ₹5.25 lakh | ₹9 lakh (12% on avg ₹37.5L exposure) | ₹89.2 lakh |
| Savings Account (No STP) | ₹2.25 lakh (3%) | ₹9 lakh (12% on avg ₹37.5L) | ₹86.5 lakh |
Lump sum produces ₹93 lakh — ₹3.8 lakh ahead of STP at 24 months. But if Preethi panic-sells during a 25% correction on ₹75 lakh fully deployed (costing her ₹18.75 lakh), the mathematical advantage of lump sum disappears entirely.
Verdict for Preethi: 24-month STP. The ₹3.8 lakh theoretical disadvantage is insured against a much larger behavioural risk.
Part 7: The LTCG Tax Dimension — SIP vs Lump Sum After-Tax
Most SIP vs lump sum comparisons ignore tax. In India post-2024, equity mutual fund gains above ₹1.25 lakh/year attract LTCG at 12.5% for units held over 1 year. STCG (under 1 year) attracts 20%.
The LTCG calendar for SIP:
Each monthly SIP instalment has its own 1-year holding period. For tax purposes, units purchased in January 2025 become long-term in January 2026. Units from February 2025 become long-term in February 2026.
SIP tax advantage: Because SIP units accumulate gradually, the taxable LTCG at any given redemption point is proportionally smaller — many units were purchased at lower prices and their cost basis is lower, meaning gains are higher — but spread over time with different lot start dates, allowing systematic LTCG harvesting.
Lump sum tax simplicity: All units share the same purchase date. After 1 year, all gains are LTCG. For large lump sums, the entire gain may exceed ₹1.25 lakh in the first redemption year — creating a significant single-year LTCG liability.
The LTCG harvesting strategy (works for both SIP and Lump Sum):
Each financial year, redeem equity units up to the ₹1.25 lakh LTCG exemption limit and immediately repurchase. This resets the cost basis annually — reducing future tax liability. On a ₹50 lakh corpus with 10% annual growth, this saves approximately ₹15,625/year in LTCG tax (₹1.25 lakh × 12.5%) — ₹3.12 lakh over a 20-year period.
As explored in the retirement withdrawal SWP guide, LTCG planning is one of the highest-leverage tax optimisations available to Indian equity investors.
Part 8: The Step-Up SIP — The Most Important Variable in the Debate
Here is the finding that reframes the entire SIP vs lump sum question for most Indians: the step-up rate on a monthly SIP has more impact on long-term corpus than whether a one-time windfall was deployed as SIP or lump sum.
Table: The Step-Up Dominates the Deployment Method
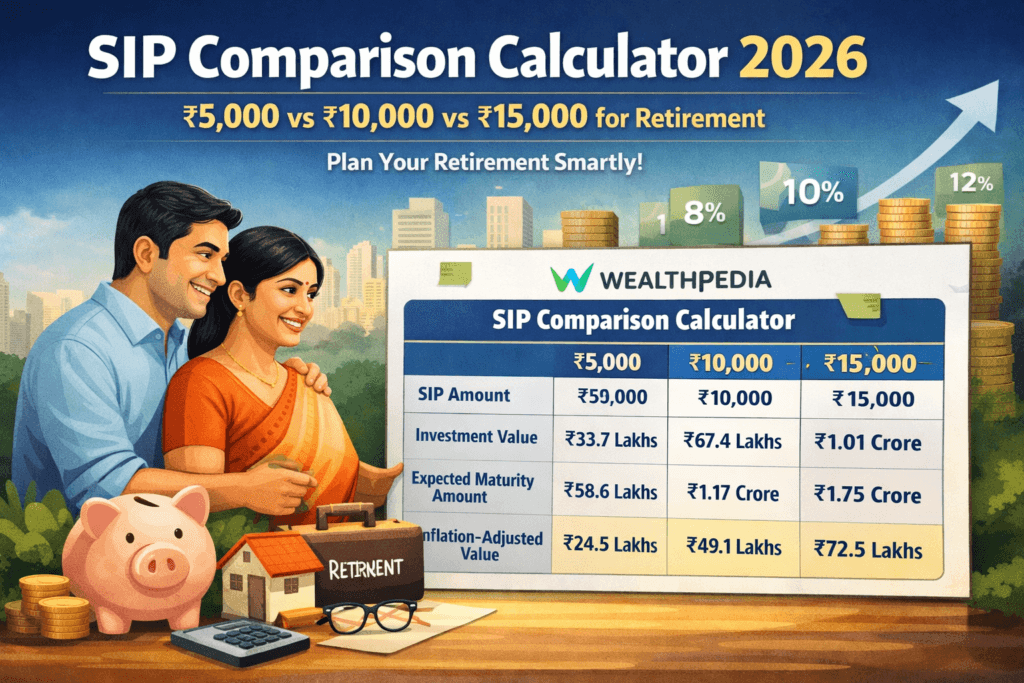
₹10,000/month SIP for 25 years at 12% CAGR vs. ₹10,000 one-time lump sum invested at various points:
| Monthly SIP Step-Up | 25-Year Corpus |
|---|---|
| 0% (Flat SIP) | ₹1.89 crore |
| 5% Annual Step-Up | ₹2.94 crore |
| 10% Annual Step-Up | ₹4.98 crore |
| 15% Annual Step-Up | ₹7.82 crore |
Compare this to: a ₹5 lakh lump sum invested 25 years ago at 12% CAGR = ₹85 lakh.
The difference between a flat SIP and a 10% step-up SIP over 25 years (₹3.09 crore) is nearly 4× the lump sum’s entire 25-year growth.
The practical implication: If you receive a ₹1.5 lakh bonus and are debating lump sum vs STP, the financial impact of that decision over 15 years is likely ₹2–5 lakh either way (based on rolling data). The financial impact of implementing a 10% annual step-up on your existing ₹15,000/month SIP over the same 15 years is likely ₹40–60 lakh.
Put more time and energy into the step-up decision than the deployment method decision. Use the SIP Allocation Optimizer to set your step-up instruction today — and then treat the lump sum deployment question as secondary.
Part 9: Common Myths Debunked
Myth 1: “SIP Always Beats Lump Sum Because of Rupee Cost Averaging”
Reality: As 23 years of data shows, lump sum wins 52% of 15-year rolling windows. RCA benefits appear mainly in volatile/correcting markets. In steadily rising markets, SIP consistently underperforms lump sum. Neither always wins.
Myth 2: “Don’t Invest a Lump Sum When Markets Are at All-Time Highs”
Reality: Markets spend approximately 70% of the time near or at all-time highs over long bull cycles. Waiting for a “better entry point” typically means staying in a savings account (3–4%) while equity compounds at 12–14%. The cost of waiting is provable; the benefit of waiting is theoretical.
The data on Nifty 50 rolling returns shows that even investors who bought at market peaks (2000, 2008, 2021) earned positive 10-year XIRR 94% of the time if they stayed invested.
Myth 3: “STP is Just a Marketing Gimmick by Fund Houses”
Reality: STP is one of the few genuinely investor-friendly products in the mutual fund industry. The liquid fund earns 6.5–7% on waiting capital. The automatic transfer eliminates timing decisions. For large windfalls, the behavioural benefit (reduced probability of panic-selling) alone justifies the STP structure.
The only legitimate critique of STP: it may generate slightly lower returns than lump sum in strongly rising markets. But the alternative (lump sum investor who panic-sells during a 30% correction) destroys far more value than the STP’s theoretical underperformance.
Myth 4: “The Method Matters Most”
Reality: Strategy matters 13× more than method. Which funds, which allocation, which step-up rate, which goal-to-fund mapping — these decisions have an order-of-magnitude larger impact on 20-year outcomes than whether a specific windfall was deployed as SIP, STP, or lump sum.
The mutual fund portfolio allocation framework and the SIP planning for 30-year-olds guide both establish this: allocation and discipline are the primary variables; deployment method is secondary.
The Decision Flowchart: Your Complete Guide
Use this to resolve any specific SIP vs lump sum question:
Q1: Is this regular monthly income?
→ Yes: SIP automatically. Go to fund selection and step-up questions.
→ No: Continue to Q2.
Q2: Is this a lump sum?
→ Yes: Continue to Q3.
Q3: Is the market down 20%+ from its 52-week high?
→ Yes: Lump sum immediately. Maximum recovery upside.
→ No: Continue to Q4.
Q4: What is the amount?
→ Under ₹2 lakh: 6-month STP or lump sum (either is fine — difference is minimal)
→ ₹2 lakh to ₹10 lakh: 12-month STP
→ ₹10 lakh to ₹50 lakh: 18–24 month STP, calibrate with Nifty P/E
→ Above ₹50 lakh: 24-month STP minimum, consider staggering to 36 months
Q5: Are you a first-time equity investor or have low crash experience?
→ Yes: Extend STP duration by 6 months from the above recommendations.
→ No: Use standard recommendation.
Final reminder: Once the deployment decision is made, focus energy on the step-up rate, allocation across goals, and annual review — these variables will dwarf the SIP vs lump sum difference over 15–25 years.
Conclusion: The Right Answer Is “It Depends” — But Now You Know What It Depends On
The SIP vs lump sum debate produces strong opinions in personal finance communities because both approaches work — in the right circumstances. The data from 23 years of Nifty 50 rolling returns makes this clear: neither method dominates unconditionally.
For regular income: SIP without question.
For windfalls in normal markets: STP.
For windfalls in a market crash: lump sum.
For all situations: step-up SIP is the most important decision, dwarfing the deployment method in long-term impact.
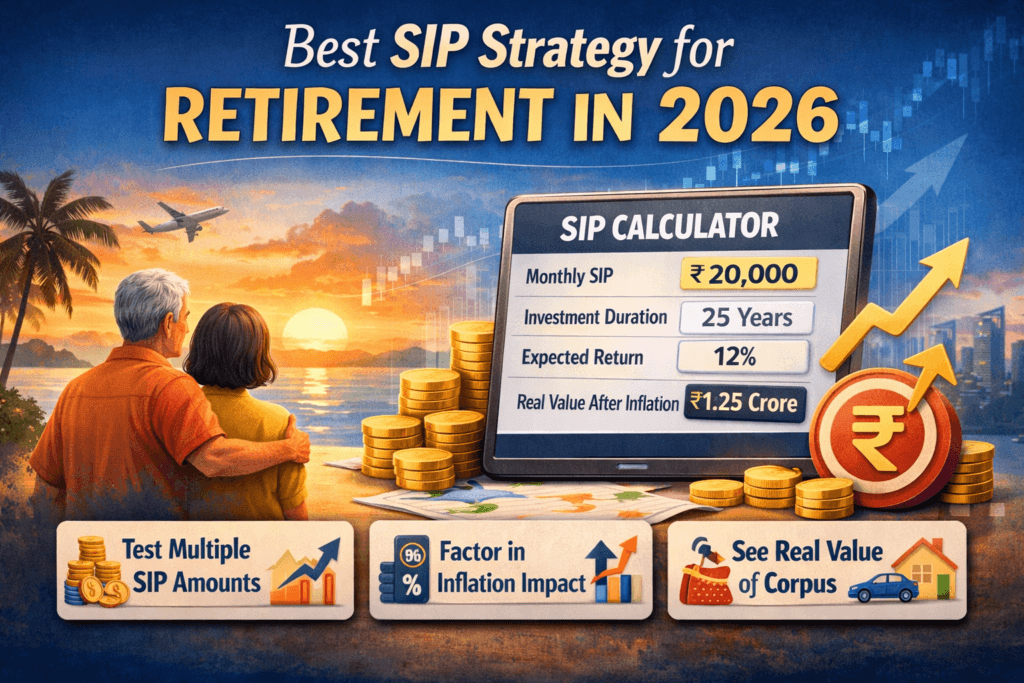
Use the SIP Comparison Calculator to model your specific scenario — plug in your windfall amount, your regular monthly investment, and see how each approach plays out at 10%, 12%, and 14% CAGR across different time horizons.
The tool that eliminates the debate is not a stronger opinion. It is your own numbers, modelled honestly, with inflation accounted for and step-up implemented from Day 1.
25 Frequently Asked Questions
Is SIP better than lump sum in India?
Neither is universally better. 23 years of Nifty 50 rolling data shows SIP wins 52% of 5-year windows; lump sum wins 52% of 15-year windows. For regular monthly income, SIP is always appropriate. For windfalls, use STP in normal markets and lump sum deployment during market corrections (Nifty down 20%+). Strategy and allocation matter 13× more than deployment method.
What is an STP (Systematic Transfer Plan) and when should I use it?
An STP parks a lump sum in a liquid fund and automatically transfers a fixed amount monthly to an equity fund. Use it for windfalls (bonus, FD maturity, inheritance) in normal or elevated markets. It earns 6.5–7% on waiting capital in the liquid fund while phasing equity entry — superior to both immediate lump sum (timing risk) and SIP from savings account (opportunity cost of idle money).
What is the advantage of SIP over lump sum in a volatile market?
In volatile markets, SIP’s rupee cost averaging benefit is real — you buy more units when prices fall. Investors who started Nifty 50 SIPs at the October 2021 peak earned 11–13% XIRR by 2024. Lump sum investors on the same date earned only 6–7.5% CAGR. The SIP floor protection is the key advantage: the worst 10-year SIP XIRR on Nifty 50 was 8.5%; the worst lump sum 10-year CAGR was approximately 4.8%.
Does lump sum beat SIP in rising markets?
Yes. In consistently rising markets, lump sum outperforms SIP by 15–25% because all capital is deployed at the lower starting price and compounds fully from Day 1. The 2020–2021 Nifty bull run is the clearest example: a lump sum at the March 2020 bottom doubled in 12 months; a 12-month STP from the same starting point returned approximately 60%.
How long should an STP run for a large windfall?
Use Nifty 50 P/E as the guide: below 18 (cheap) — 6-month STP or lump sum; 18–22 (fair value) — 12 months; 22–26 (moderately expensive) — 18 months; above 26 (expensive) — 24 months. For first-time equity investors, add 6 months to the above. As of mid-2026, the Nifty P/E at 22–24× suggests an 18-month STP for large windfalls.
What is rupee cost averaging and does it actually work?
Rupee cost averaging (RCA) means investing a fixed amount regardless of price — buying more units when prices are low and fewer when high, resulting in a lower average cost per unit than the simple average of prices. It works in volatile markets. In steadily rising markets, each monthly SIP buys at a higher price than the previous — RCA provides no benefit. Its real value is psychological: it removes timing decisions and keeps investors disciplined during corrections.
Should I invest my annual bonus as a lump sum or SIP?
For most Indian salaried professionals, an STP over 6–12 months is optimal for annual bonuses. Park the full amount in a liquid fund immediately (not savings account), then set up monthly STP to your equity fund. For bonuses under ₹1 lakh, the difference between lump sum and STP is minimal over a 10-year horizon — choose whichever requires less manual intervention.
What happens if I invested a lump sum at a market peak?
You experience the full drawdown on your entire capital. However, historical data shows that even peak investments on Nifty 50 generated positive XIRR over 10-year periods in 94% of cases. The risk is not permanent loss — it is temporary pain and the psychological pressure to sell at the bottom. Staying invested through the correction determines whether peak-entry lump sum investments ultimately succeed or fail.
Is SIP always safe?
SIP reduces timing risk but does not eliminate market risk. A SIP can generate negative XIRR over short periods (under 3 years) if markets decline consistently. Over 10-year+ horizons, 94% of Nifty 50 SIP starts produced positive XIRR. SIP is safest for long-horizon goals (15+ years) — not for goals within 3–5 years where capital preservation matters.
What is the minimum STP period?
Technically you can STP over 3 months. Practically, under 6 months eliminates most of the timing risk benefit. 6–12 months is the practical minimum for meaningful risk reduction. For amounts above ₹10 lakh in a high-valuation market, 12–24 months is appropriate.
Can I do an STP between different AMCs?
Yes, but inter-AMC STP requires manual execution — you set up a monthly redemption from Fund A (liquid) and a monthly purchase in Fund B (equity) separately. Most investors prefer intra-AMC STP (same fund house) because it executes automatically in one instruction. If your preferred equity fund is with a different AMC than your liquid fund, intra-AMC transfer to the equity AMC’s liquid fund first, then STP.
How does STP compare to SWP (Systematic Withdrawal Plan)?
They are mirror-image strategies. STP moves money from debt/liquid to equity (deployment phase). SWP moves money from equity/debt to bank account (withdrawal phase, retirement). Both are systematic, automated, and reduce timing concentration. For a FIRE retiree, the SWP from the retirement withdrawal plan is the reverse of the STP used during accumulation.
Does SIP work during a bear market?
Yes — and this is precisely when SIP is most valuable. During a bear market, each SIP instalment buys units at progressively lower prices. When the recovery comes, the investor has accumulated a large number of low-cost units that surge in value. Investors who continued SIPs through 2008–2009, 2020, and 2022 corrections significantly outperformed those who paused.
What is the tax treatment of STP?
Each STP transfer is technically a redemption from the liquid fund (triggering short-term capital gains tax on liquid fund gains, taxed at income slab rate) and a fresh investment in the equity fund. Liquid fund gains per instalment are typically small (1–2 months of 7% annual return on each lot), so STCG tax is modest. Factor this into STP cost vs benefit analysis for large amounts in high-income brackets.
Is it too late to start SIP if I am 40?
No. A ₹20,000/month SIP with 10% annual step-up at 12% CAGR from age 40 builds approximately ₹2.3 crore by age 60 — sufficient for many retirement scenarios. The SIP planning guidance for late starters establishes that the key adjustments for 40+ investors are: higher starting SIP amount, more aggressive step-up, and potentially a slightly later FIRE target (62–65 vs 58).
What is the difference between SIP XIRR and lump sum CAGR?
XIRR (Extended Internal Rate of Return) accounts for the timing of each cash flow — appropriate for SIPs where different amounts are invested on different dates. CAGR (Compound Annual Growth Rate) applies to a single initial investment. Always compare SIP XIRR vs lump sum CAGR — comparing CAGR to CAGR for SIPs significantly understates SIP returns because it ignores the timing advantage of later, lower-cost units.
How do I decide between lump sum and SIP for a child’s education fund?
If the child is young (under 5 years) and you have a lump sum available: 12-month STP into an equity fund. If the child is over 10 years: the remaining horizon is too short for aggressive equity lump sum — use conservative hybrid or short-duration debt SIP. As detailed in the child education SIP guide, the glide path from equity to debt in the final 5 years is more important than the initial deployment method.
Is SIP better for first-time equity investors?
Yes — strongly. First-time equity investors have not experienced a 30–50% portfolio drawdown. A lump sum investor seeing ₹5 lakh fall to ₹3.5 lakh in 6 months is far more likely to exit than an SIP investor who has accumulated ₹5 lakh gradually and watches it temporarily fall to ₹3.5 lakh. SIP builds conviction through the accumulation process — each monthly investment is a small bet, not a large one.
Should I stop SIP when the market is falling?
Never. This is the most expensive SIP mistake. A falling market means each SIP buys units at lower prices — your cost averaging is most powerful exactly when you most want to stop. Investors who stopped SIPs in March 2020 missed the fastest recovery in Indian equity history. If you must act, consider increasing the SIP amount during significant corrections — not stopping it.
How does the step-up SIP compare to a one-time lump sum over 25 years?
A ₹10,000/month SIP with 10% annual step-up over 25 years at 12% CAGR builds ₹4.98 crore. A ₹5 lakh lump sum invested 25 years ago at 12% CAGR grows to ₹85 lakh. The step-up SIP total contribution (₹1.0 crore) produces nearly 6× the corpus of the lump sum. Step-up discipline matters more than any single deployment decision.
Can I combine SIP and lump sum in the same fund?
Yes — and this is common and sensible. Your regular monthly SIP runs in the equity fund. When you receive a windfall, you set up an STP from a liquid fund to the same equity fund. The STP runs parallel to your SIP. The equity fund accumulates units from both sources — your regular income SIP and the windfall STP simultaneously.
What is the STP advantage over direct lump sum in equity?
Two specific advantages: (1) Liquid fund earns 6.5–7% on the waiting balance — not 3% in savings. On ₹5 lakh over 12 months, the difference is approximately ₹17,500 in additional return. (2) Phased equity entry reduces the probability of experiencing maximum drawdown on the full amount — protecting both the corpus and the investor’s psychological commitment to the investment.
How should I invest a large inheritance in India?
For inheritances above ₹25 lakh: 24-month STP minimum. For larger amounts (₹1 crore+), consider 36 months with a P/E-calibrated approach. Never deploy a large inheritance as a single lump sum — the psychological and financial risk of deploying peak-capital at market highs is too significant for a once-in-a-lifetime event. The capital preservation during the STP period in liquid funds is worth the modest opportunity cost vs immediate equity deployment.
Does the SIP vs lump sum decision matter for PPF and EPF?
PPF contributions are mandatorily staggered (maximum ₹1.5 lakh/year in 12 monthly instalments or lump sum before April 5 each year). For PPF, investing the annual ₹1.5 lakh as a lump sum on April 1 is mathematically optimal — it earns the full year’s 7.1% interest starting April 1 rather than on a monthly average. The PPF case is one of the few where lump sum (early year deployment) unambiguously wins.
What is the single most important insight from the SIP vs lump sum research?
Strategy matters 13× more than method. The 23-year Nifty 50 rolling data shows that neither SIP nor lump sum dominates across all conditions. What does dominate: which funds you are in, how you have allocated across categories, whether you implemented the annual step-up, whether you stayed invested through crashes, and whether your corpus is goal-aligned. Optimise the allocation and step-up first. Then make the deployment decision. In that order.
Disclaimer: All historical return data is based on publicly available Nifty 50 index data and rolling return analyses. Past performance does not guarantee future returns. This article is for educational purposes only. Wealthpedia is not a SEBI-registered investment advisor. Consult a qualified financial planner before making investment decisions. Wealthpedia® is a registered trademark (TM No. 4910385).
Vishal Jhaveri is the founder of Wealthpedia and an MBA Finance professional with over 10 years of experience in financial planning, investing, and wealth creation. He specializes in FIRE (Financial Independence, Retire Early), retirement planning, investing, and personal finance education. Through Wealthpedia, he develops financial calculators and publishes evidence-based content to help Indian investors make informed financial decisions. He regularly reviews and updates Wealthpedia articles to reflect changes in tax, laws, investment regulations, and personal finance best practices.
Quick Wrap up