
For the overwhelming majority of EPS members — whose pensionable salary is capped at ₹15,000 regardless of actual earnings — service years are not just one input among many. They are effectively the only variable that determines pension growth over a career. Understanding precisely how each additional year of service translates into additional pension, where the growth curve bends, and where it flattens entirely, is essential for anyone making career and retirement timing decisions.
This analysis maps the complete relationship between service years and EPS pension, identifies the specific points where service decisions carry outsized financial weight, and explains the underlying mechanics driving each pattern.
Use the EPS Pension Calculator India to model your own pension trajectory based on your actual career timeline.
Quick Summary
Service years are the single biggest lever most EPS members have over their pension amount, since pensionable salary is fixed at the ₹15,000 ceiling for the majority of members. Each pensionable year at this ceiling is worth a flat ₹214.29/month — except at the 20-year mark, where the 2-year bonus creates a one-time disproportionate jump worth 3× a normal year. This article analyses the complete pension growth curve from 1 year to the 35-year maximum, identifies the highest-leverage single-year decisions in an EPS career, and explains why the marginal value of additional service years diminishes as members approach the cap. Use the EPS Pension Calculator India to model your own service trajectory.
Join Now →
The Three Phases of EPS Pension Growth
Analysing the complete pension curve from 1 to 40 years of service reveals three distinct phases, each governed by different mechanics:
Phase 1 — Pre-Eligibility Phase (1 to 9 Years)
During this phase, the member is not yet eligible for monthly pension at all. Service below 10 years qualifies only for the Table D lump-sum withdrawal benefit or a Scheme Certificate — there is no monthly pension to analyse in terms of “growth” during this phase, since the benefit structure is entirely different (a one-time lump sum rather than a recurring pension).
See EPS Withdrawal Benefit Calculator for the Table D mechanics that apply during this phase.
Phase 2 — Linear Growth Phase (10 to 19 Years)
Once 10 years is crossed, monthly pension becomes available, and it grows in a perfectly linear fashion:
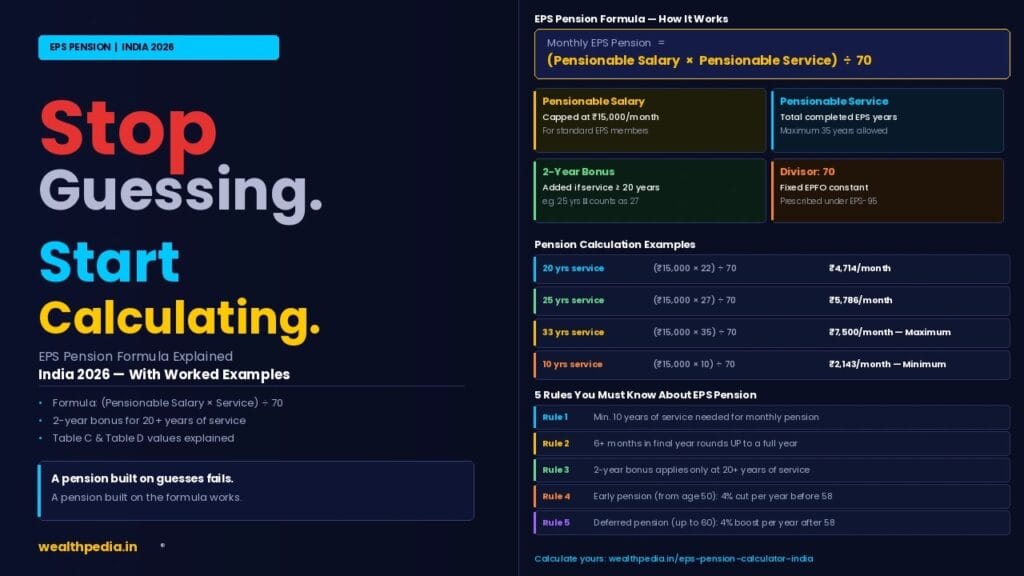
Each additional year of service adds exactly ₹214.29/month (at ₹15,000 pensionable salary)
| Service Years | Monthly Pension | Increase from Previous Year |
|---|---|---|
| 10 years | ₹2,143 | — |
| 11 years | ₹2,357 | +₹214 |
| 12 years | ₹2,571 | +₹214 |
| 13 years | ₹2,786 | +₹214 |
| 14 years | ₹3,000 | +₹214 |
| 15 years | ₹3,214 | +₹214 |
| 16 years | ₹3,429 | +₹214 |
| 17 years | ₹3,643 | +₹214 |
| 18 years | ₹3,857 | +₹214 |
| 19 years | ₹4,071 | +₹214 |
This phase is entirely predictable — every additional year of pensionable service contributes the same fixed increment, with no surprises or inflection points.
Phase 3 — Bonus-Adjusted Linear Growth Phase (20 to 33 Years)
| Service Years | Pensionable Service (with bonus) | Monthly Pension | Increase from Previous Year |
|---|---|---|---|
| 19 years | 19 | ₹4,071 | — |
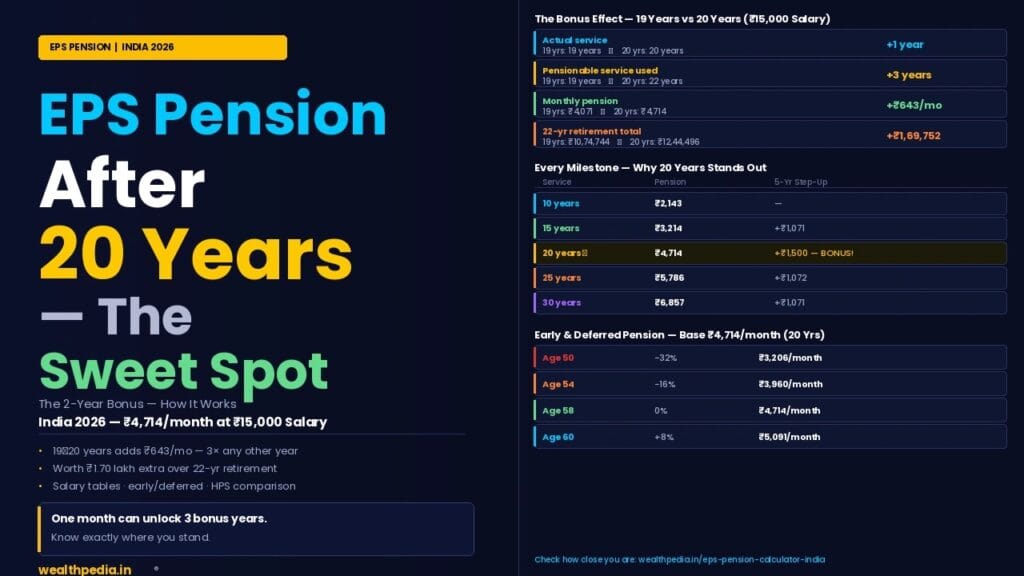
| 20 years | 22 | ₹4,714 | +₹643 (bonus jump) |
| 21 years | 23 | ₹4,929 | +₹214 (normal) |
| 22 years | 24 | ₹5,143 | +₹214 (normal) |
| 25 years | 27 | ₹5,786 | +₹214/year (average) |
| 30 years | 32 | ₹6,857 | +₹214/year (average) |
| 33 years | 35 (max) | ₹7,500 | +₹214 (final increment) |
The single jump from 19 to 20 years (+₹643/month) is 3 times the value of every other individual year in the entire 35-year range — a direct consequence of the 2-year bonus adding 3 effective pensionable years (1 actual + 2 bonus) instead of the usual 1.
For a deep dive into this specific threshold, see EPS Pension After 20 Years.
Phase 4 — Flatline Phase (33+ Years)
Once actual service reaches 33 years (which becomes 35 pensionable years with the bonus), the pension permanently flatlines:
| Service Years | Monthly Pension | Increase from Previous Year |
|---|---|---|
| 33 years | ₹7,500 | +₹214 (final increase) |
| 34 years | ₹7,500 | +₹0 |
| 35 years | ₹7,500 | +₹0 |
| 38 years | ₹7,500 | +₹0 |
| 40 years | ₹7,500 | +₹0 |
No amount of additional service beyond 33 years increases standard EPS pension. For the complete cap mechanics, see EPS Pension After 35 Years Service.
The Complete Pension Growth Curve — Visualised in Numbers
| Service Years | Monthly Pension | Cumulative Growth from 10 Years | % of Maximum |
|---|---|---|---|
| 10 | ₹2,143 | — | 28.6% |
| 15 | ₹3,214 | +₹1,071 | 42.9% |
| 19 | ₹4,071 | +₹1,928 | 54.3% |
| 20 | ₹4,714 | +₹2,571 | 62.9% |
| 25 | ₹5,786 | +₹3,643 | 77.2% |
| 30 | ₹6,857 | +₹4,714 | 91.4% |
| 33 | ₹7,500 | +₹5,357 | 100% |
| 35+ | ₹7,500 | +₹5,357 | 100% (flat) |
This table reveals the shape of the entire curve: steady incremental growth, a single disproportionate jump at year 20, continued steady growth, and then a hard ceiling.
Identifying the Highest-Leverage Service Year Decisions
Not all years of EPS service carry equal financial weight. Based on the growth curve analysed above, here are the specific points where service timing decisions matter most:
Highest Leverage — The 19-to-20-Year Transition
Value: ₹643/month for life (3× normal annual increment)
This is unambiguously the single most consequential year in an entire EPS career. An employee at 19 years and 5 months who works just 1 more month (crossing into 19 years 6 months, which rounds up to 20 years) permanently unlocks the 2-year bonus.
Second-Highest Leverage — The 9-to-10-Year Transition
Value: The difference between a one-time lump sum and a lifetime monthly pension
While not a “growth” comparison in the same sense (since below 10 years there is no monthly pension at all), crossing from 9 years to 10 years of service converts a one-time Table D withdrawal (typically ₹1–1.5 lakh depending on salary) into a lifetime pension stream worth several lakh rupees over a typical retirement. See EPS Pension After 10 Years for the complete comparison.
Lower Leverage — Every Other Individual Year
Value: ₹214.29/month (standard increment)
Every year outside the two transitions above carries the same standard incremental value. These are still meaningful in aggregate (5 years = over ₹1,000/month) but do not carry the same single-decision urgency as the two threshold transitions.
Zero Leverage — Any Year Beyond 33 Actual Years
Value: ₹0/month for EPS purposes
Working beyond 33 actual years of service provides no additional EPS pension whatsoever, though it continues to grow the uncapped EPF corpus and may provide other career benefits.
Why Service Years Matter More Than Salary for Most Members
For the majority of EPS members (whose pensionable salary is at or above the ₹15,000 ceiling), service years are the only variable that can change. Salary negotiations, promotions, and raises have zero impact on EPS pension once basic+DA crosses ₹15,000 — only continued service (and crossing the 20-year bonus threshold) moves the pension needle.
This creates an important strategic insight: for EPS-specific planning purposes, decisions about career continuity and timing matter more than decisions about salary negotiation. An employee focused purely on maximising EPS pension should prioritise:
- Reaching 10 years (pension eligibility)
- Reaching 20 years (2-year bonus)
- Reaching 33 years (maximum pension)
…over negotiating a higher basic salary once already above ₹15,000, which has no EPS pension effect (though it does still benefit the uncapped EPF corpus).
For members on the Higher Pension Scheme, this dynamic shifts — since HPS removes the salary ceiling, both salary and service years matter proportionally. See EPS Higher Pension Scheme: Eligibility & Calculation for that separate calculation framework.
Service Years and Career Break Timing
Understanding the growth curve has direct implications for how EPS members should time career breaks, sabbaticals, or transitions to non-EPF-covered work:
Before 10 Years
A career break here has no EPS pension cost beyond losing the accumulating service toward the 10-year threshold (though Table D withdrawal or Scheme Certificate options remain available).
Between 10 and 19 Years
A career break here locks in the linear-phase pension at whatever level was reached — each year of break “costs” ₹214.29/month in foregone future pension growth, in addition to whatever EPF growth is also forgone.
Approaching 20 Years (19 Years 0–5 Months)
This is the worst possible time to take an extended career break. Stopping just before crossing the 19 years 6 months rounding threshold means permanently forfeiting the 2-year bonus — a loss of ₹643/month for life, compared to working just 1–6 more months.
Just After 20 Years
Once the bonus is locked in, career break timing returns to the standard ₹214.29/month-per-year calculus, without the urgency of the threshold.
Approaching 33 Years
A career break here has minimal additional EPS cost, since the member is already very close to (or at) the maximum pension. The opportunity cost of stopping here is much lower than stopping just before the 20-year threshold.
Service Years and Multi-Employer Careers
For members with multiple employers, the service-years growth curve applies to total cumulative pensionable service, not service at any single employer. This means:
- An employee with 8 years at Employer A and 13 years at Employer B (properly transferred via UAN) has 21 years of total pensionable service — already past the 20-year bonus threshold
- The growth curve mechanics (linear growth, bonus at 20, cap at 35) apply identically regardless of how many employers contributed to the total
The critical risk, as discussed in EPS Pension for Private Sector Employees, is ensuring all employer periods are correctly combined via UAN transfer or Scheme Certificate — failure to do so resets the growth curve calculation to a lower total, potentially missing key thresholds like the 10-year eligibility or 20-year bonus marks.
Modelling Your Own Service Years Trajectory
To apply this analysis to your own career:
Step 1 — Determine your current pensionable service using your EPFO passbook (passbook.epfindia.gov.in), applying the 6-month rounding rule. See What Is Pensionable Service Under EPS? for the complete counting rules.
Step 2 — Identify your nearest threshold. If you are below 10 years, your priority is reaching pension eligibility. If you are between 10 and 19 years 5 months, your priority is reaching the 19 years 6 months bonus threshold. If you are past 20 years, you are in steady linear growth until 33 years.
Step 3 — Use the calculator to project forward. The EPS Pension Calculator India lets you input your joining date and projected exit date to see exactly how your pension grows under different career-length scenarios.
Step 4 — Time major career decisions around thresholds, particularly the 19 years 6 months bonus threshold, if your timeline allows flexibility.
Service Years Impact — Quick Reference Summary
| Service Range | Growth Pattern | Per-Year Value |
|---|---|---|
| 1–9 years | No monthly pension (Table D withdrawal only) | Not applicable |
| 10–19 years | Linear growth | ₹214.29/month per year |
| 19 → 20 years | Bonus activation (one-time) | ₹643/month (3× normal) |
| 21–33 years | Linear growth (bonus already applied) | ₹214.29/month per year |
| 33+ years | Flatline — capped at maximum | ₹0/month per additional year |
Frequently Asked Questions — Impact of Service Years on EPS Pension
How much does each year of EPS service increase my pension?
At the ₹15,000 pensionable salary ceiling, each additional year of service adds ₹214.29/month — except the transition from 19 to 20 years, which adds ₹643/month due to the 2-year bonus activating. Beyond 33 years, additional service adds ₹0/month since the pension is capped.
Which single year of EPS service is most valuable?
The transition from 19 to 20 years of service is the single most valuable year in the entire EPS framework, worth ₹643/month for life — three times the value of any other individual year — because it triggers the 2-year bonus.
Does service beyond 33 years increase my EPS pension at all?
No. Once pensionable service reaches the 35-year maximum (achieved at 33 actual years due to the 2-year bonus), no additional service years increase EPS pension further. Working 35, 38, or 40 years produces the identical pension as working exactly 33 years.
Why do service years matter more than salary for most EPS members?
Because pensionable salary is capped at ₹15,000 for the vast majority of members (those not on the Higher Pension Scheme), salary increases above this ceiling have zero effect on EPS pension. Service years remain the only variable that can meaningfully change the pension outcome for these members.
What happens to my EPS pension growth if I take a career break at 19 years?
If the break occurs before reaching 19 years 6 months of service (which rounds up to 20 years), you permanently miss the 2-year bonus — a loss of ₹643/month for life compared to working just a few more months to cross the threshold. This is the single worst-timed career break possible from an EPS perspective.
Is the per-year pension growth the same for all salary levels?
The per-year growth rate scales with salary, but the same threshold patterns apply. At ₹10,000 salary, each year is worth approximately ₹142.86/month (10,000 ÷ 70), and the 20-year bonus jump would be approximately ₹429/month (2 × 142.86 × 1.5, accounting for the 3-year effective jump) — proportionally similar to the ₹15,000 example but scaled down.
How does the Higher Pension Scheme change the service-years growth curve?
Under HPS, the same service-year mechanics apply (linear growth, 2-year bonus at 20 years, 35-year cap), but the per-year value scales with actual salary instead of the ₹15,000 ceiling. At ₹50,000 average salary, each pensionable year is worth approximately ₹714.29/month, making the 20-year bonus transition worth over ₹2,140/month instead of ₹643. See EPS Higher Pension Scheme.
Does combining service from multiple employers affect the growth curve mechanics?
No — the growth curve (linear phases, bonus threshold, cap) applies identically to total cumulative pensionable service, regardless of how many employers contributed to that total. The key requirement is ensuring service is properly combined via UAN transfer or Scheme Certificate rather than forfeited through withdrawal at any employer transition.
What is the cumulative pension growth from 10 years to the maximum?
From 10 years (₹2,143/month) to the maximum at 33 years (₹7,500/month), the cumulative growth is ₹5,357/month — a 250% increase over the minimum-eligibility pension, achieved through 23 additional years of service.
Where can I model how my own service years will translate into pension growth?
Use the EPS Pension Calculator India on Wealthpedia. Enter your date of joining EPS and various potential exit dates to see exactly how your pension changes at each service milestone, including the bonus and cap mechanics explained in this analysis.
Disclaimer: The information on this page is for educational purposes only and does not constitute investment or financial advice. EPS rules governing service years and pension calculation are set by EPFO under EPS-95 and may be updated by the Government of India. For personalised guidance, consult a SEBI-registered financial planner or visit your nearest EPFO office. Wealthpedia™ (Trademark Reg. No. 4910385) is not a SEBI-registered investment advisor. All mutual fund references on this site are for Direct Plan, Growth option only.

Vishal Jhaveri is the founder of Wealthpedia and an MBA Finance professional with over 10 years of experience in financial planning, investing, and wealth creation. He specializes in FIRE (Financial Independence, Retire Early), retirement planning, investing, and personal finance education. Through Wealthpedia, he develops financial calculators and publishes evidence-based content to help Indian investors make informed financial decisions. He regularly reviews and updates Wealthpedia articles to reflect changes in tax, laws, investment regulations, and personal finance best practices.
Quick Wrap up